
Perfect Analysis Services (SSAS) reports in Excel using Power Query

Excel-reports on SSAS cubes (multidimensional and tabular) can have some flaws that now can be overcome by using Power Query for sourcing your cubedata:

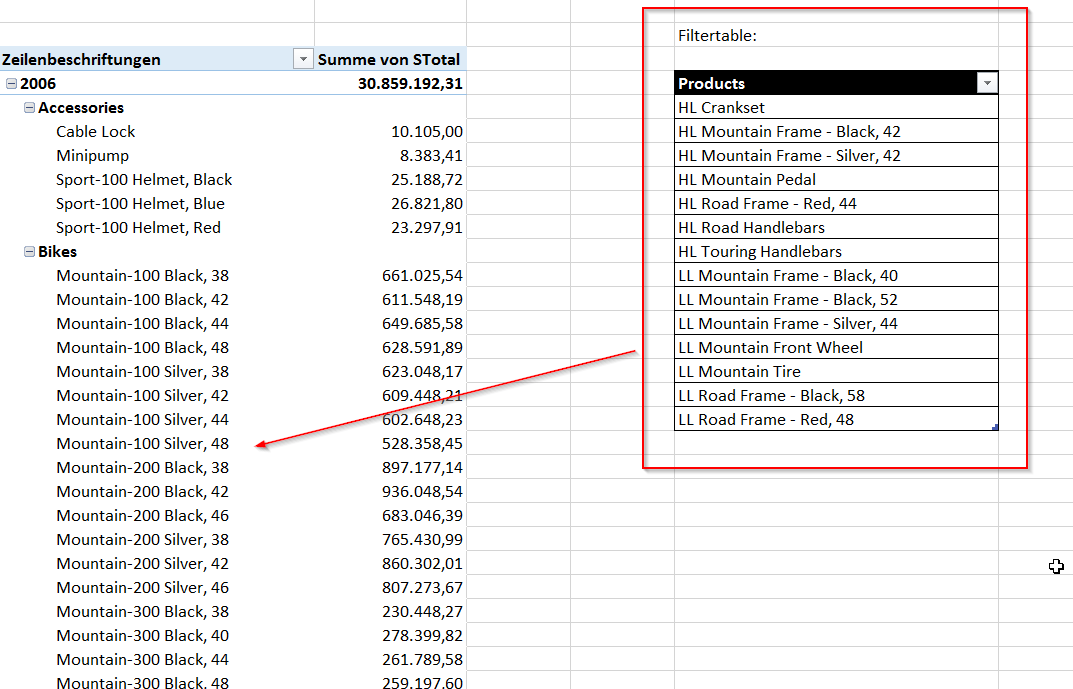
  • filter your cube by complete Excel-tables without loading them to the model/cube
  • Apply nice number and date formats to non-measure number and date fields in your row- or column section
  • create fast detailed reports (multiple attributes in your row sections, overcome the slow MDX that the pivots on cubes produce)

As with the recent Power Query update (26) you can now create your own MDX and DAX-statements for retrieving data from a cube, it is also possible to pass individual parameters from your Excel-sheet to the queries. This is a prerequisite for dynamically reducing the number of returned fields to the query, thereby allowing a decent performance of these reports.

So how about filtering the query by a table that sits in your local Excel file? Can we do an inner-join just like on the SQL-server-source

Read more

Excel Cubefunctions: Trick for dynamic sets

Today I read Andrew Todd’s brilliant guest post on Powerpivotpro.com about some really cool tricks on cubefunctions. The second one shows a very elegant solution to what I’ve formerly done with my “hidden-Pivot”-technique: Avoid the cubeset-functions by referencing a hidden pivot table instead. So if the set of “cubeslices” you want to use in your reports is static, this is the most elegant way to go in my eyes.

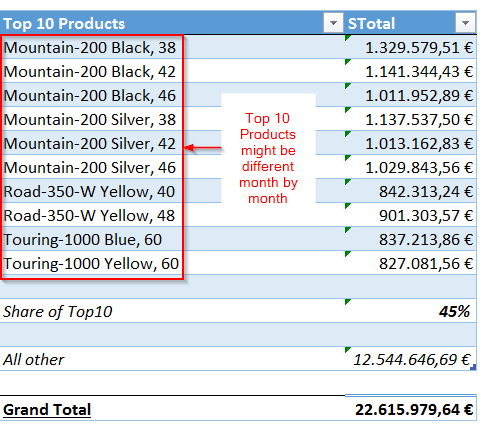
But if it is dynamic, like in a Top-10 ranking or similar, this technique still has it’s reason of being: Say you want to show a section in your dashboards that shows top-x elements, a calculation of their share on the total, then an aggregation on all others and a sum on all like this:

NewImage1

Read more

Power Query Management Studio reloaded: Now supports MDX

Very happy to see that my Power Query Management Studio isn’t just perceived nerdy but useful as well 🙂 Thanks to Dusty for his nice review.

So let’s push it a bit further and add some MDX functions to it that cannot be done by DMVs:

  • get a list of all unique fields used in a specific MDX query
  • translate your code to a different cube using a simple field-translation table

How to use this for MDX:

Read more

Use Timeline or Slicers to filter your Power Query import

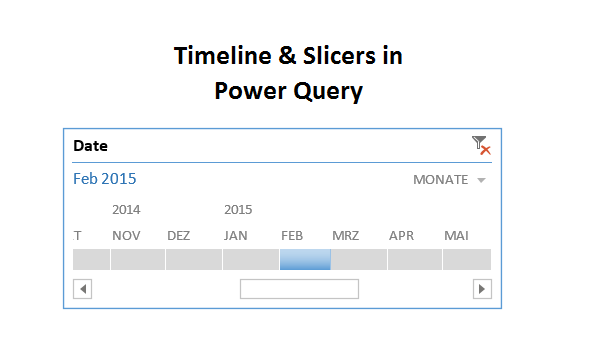
A question in the Mr. Excel forum this morning reminded me that the technique I’ve blogged about here could also be used to do simpler things like using a timeline slicer to filter your Power Query imports. So here’s a quick shot on this: Import your calendar table into the data model (load only) Create … Read more

Report Design with Power Query (1): Cascading Time Granularities

Cascading Time Granularities

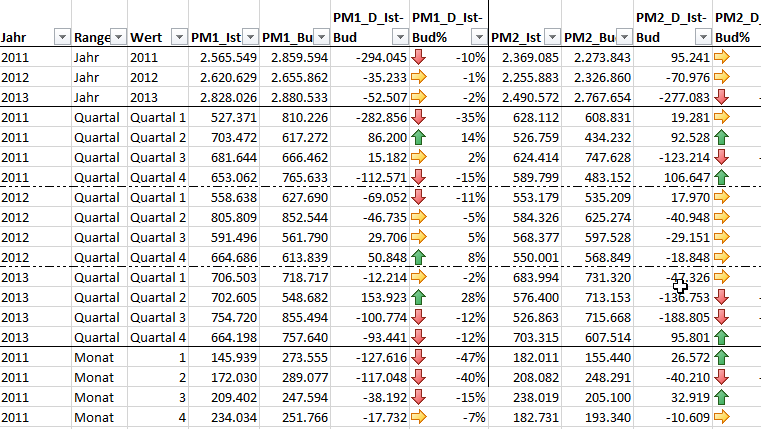
When the client is not happy with the pivot report layout options on cubes in Excel, my usual reaction is “OK no problem, then we’re going to use cubefunctions instead”. This went well until recently: My client told me that he wanted a report like above: Years totals first, followed by quarters & months totals, but with growing number of years! All nicely close together, no gaps. Normally I don’t mind cubereports with dynamic table length (will blog about this later), but this is basically 3 dynamic reports under each other (yes they are still alive and will probably stay 😉 ):

  Screen_3Years

So it was time to test what Chris Webb has talked about in this blogpost: Using Power Query as a report authoring tool in Excel. The idea was to use Power Query’s append-function to attaching 3 different report: Year, Quarter, Month. They could then have different lengths, the append-operation would seamlessly stitch them together. The connection to the cubedata was easy enough, thanks to his brilliant step-by-step guide. But then there were some challenges to solve:

Read more