How to create a Waterfall Chart using Power Query?
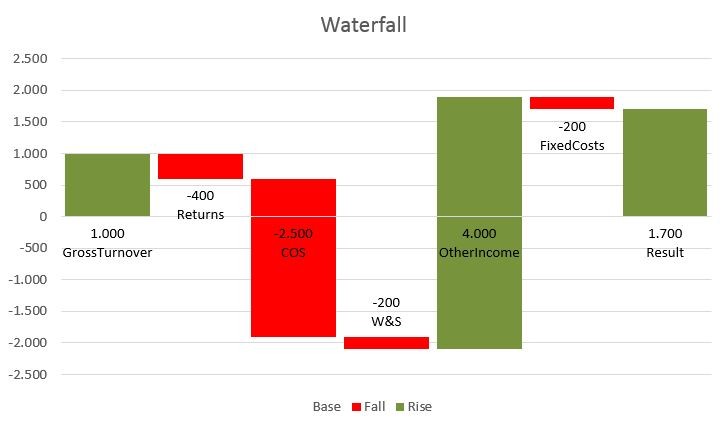
Target is a chart like above: Starting point, several movements & then an ending sum. Every movement starts at the end of the previous movement, upsides in green colour, downsides in red.
The source data for this kind of charts are normally missing the last line like this example with a P&L:
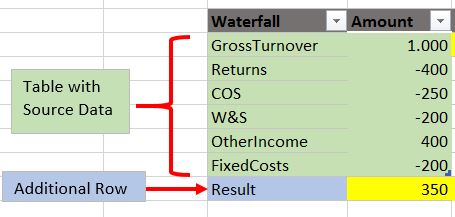
So this makes it always a bit clumsy to integrate in an automatically refreshing reporting package, especially if the number of lines/bars to report is dynamic.
So here comes the Power Query solution: Fully automatic & dynamic – calculation & charting.
Simply update your source data (Table: “Sourcedata”) & the rest will be done automatically. In this simple example the order of the Sourcedata-table will be kept in the chart.
Refresh the query or check “Data – refresh all” – done.
You can use this as it is – just prepare your table accordingly (fill in your numbers manually, create links or a power query to your source data… however), no need to adjust the query or even have a look at it.
Waterfall
But if you’re interested in how this works, just read on 🙂
Read more