How to create a Load History or Load Log in Power Query or Power BI

If you want to collect your regularly loaded data without overwriting it or create a load log that writes the load activites with a timestamp into a table, you need to create a query that adds new lines to it’s own latest version.

In both cases you add a column that returns the current day and time using DateTime.LocalNow()
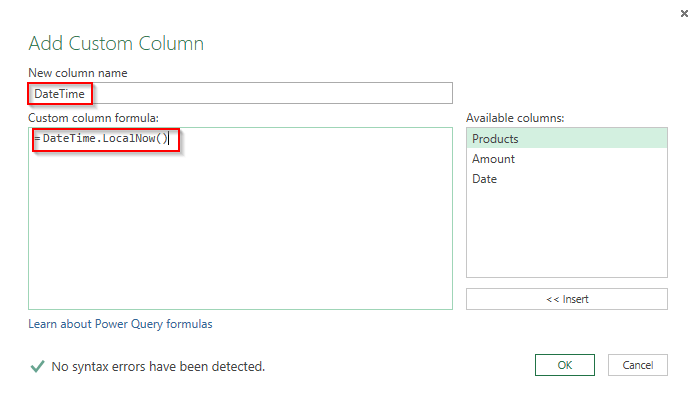
Image1

Load Log the PowerBI-way

Then using Power BI it’s fairly easy: Use the R-extension to perform an append query to the external txt or csv-file like described in this post (incremental load):

require(gdata)
write.table(trim(dataset), file=”your filepath & filename.txt”, sep = “\t”, row.names = FALSE, append = TRUE, column.names=FALSE)
plot(dataset);

Load Log the Power Query-way

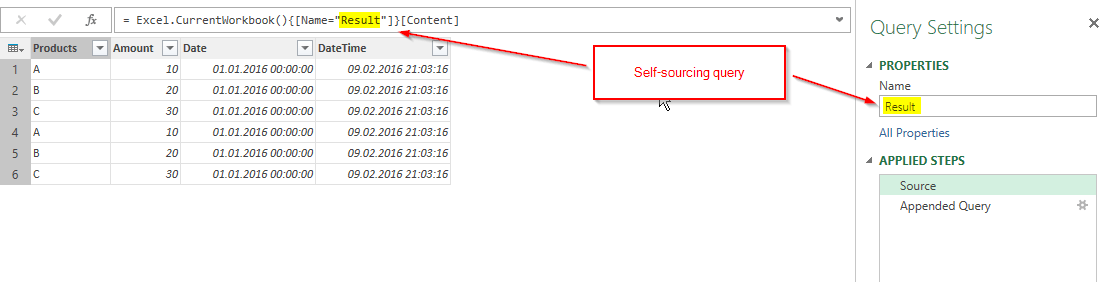
In Excel’s Power Query it’s a bit trickier, because you cannot export your queries and therefore need to create the consolidated table in your workbook itself. And it must be a self-referencing query or to be more precise: a self-sourcing query: A query that takes its latest output as its new input, then appends the new data and overwrites the old result with the new one.

How do we deal with this? When we write the query we don’t have the result yet to be referenced?

Read more

Power Query & Power BI are ideal learning paths from Excel to R

Reading Jen Stirrup’s great article about the learning path for SQL Server 2016 and R I ended up learning my first R pieces from this wonderful post that she has referenced. There Tony Ojeda beautifully describes how basic Excel-concepts are translated into R.

Well – I cannot speak of so much personal experience here – but these R-codes came easy as nothing before to me. Apart from Tony’s first class didactics, could this be due to what I’ve learned in Power Query over the last year?

I’ve added the comparison of Excel and R by the M-code from Power Query – putting it in the middle:

RandPowerQueryV3

Do you find the similarities as striking as I do?

Read more

Tip for Parameter Tables in Power Query and Power BI

Parameter tables in Excel are normally set up like this: In order to retrieve the currency for example, you could write this: = Parameters[Value]{2} This returns the content of the “Value”-column of the query named “Parameter” that sits in the 3rd row (! Power Query starts to count at zero): EUR. Which is not bad, but also not … Read more

Happy Spreadsheet Day! (Or how to escape Excel-hell)

When reading horror-stories about Excel-hell describing how dangerous it is to use Excel in corporate environments, I cannot help but to think of this hilarious video describing the fatal consequences of acting without common sense: Just don’t do stupid things with it.

Although Excel comes nearly for free (in relation to what value it delivers) this doesn’t mean that you don’t need to invest in applying proper techniques (like in any other profession). There’s training and best practices for every different need.

But the best thing about Excel seems largely unknown still: Since the invention of Power Query it has never been easier to be save around Excel than before: A magic tool that can solve many of the problems that cause Excel hell: Repetitive tasks: The little adjustments and extensions that pile up when you use your workbook again and again and are often performed without realizing the (meanwhile complex) context of all the standard-Excel-elements involved: Power Query will prevent this mess. It will help you organize and automize your repetitive tasks in Excel.

Read more

How to auto-parametrize your Power Query queries

This is about a technique that I’m going to use in my upcoming articles on ICT reconciliation. But as it is useful in other areas as well, it’s getting its own post here:

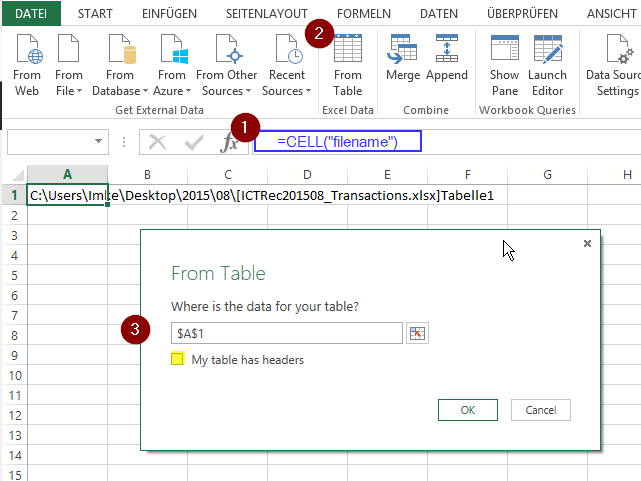
Say we want to pass the year and month as well as the type of accounts as filters/parameters into our reconciliation query. If our file is stored here:

C:\Users\Imke\Desktop\2015\08\\ICTRec201508_Transactions.xlsx,

we have everything we need. And when the next month comes, we even don’t have to adjust our query, as it will automatically take 09 as the months parameter, providing we store it in the correct folder.

Using: CELL(“filename”) will extract this information into the cell in Excel. Check this cell and pass it to Power Query (as table).

Image1

Now we just have to extract the relevant parts, using an ultracool ninja-trick I just picked up in the TechNet Forum:

Read more

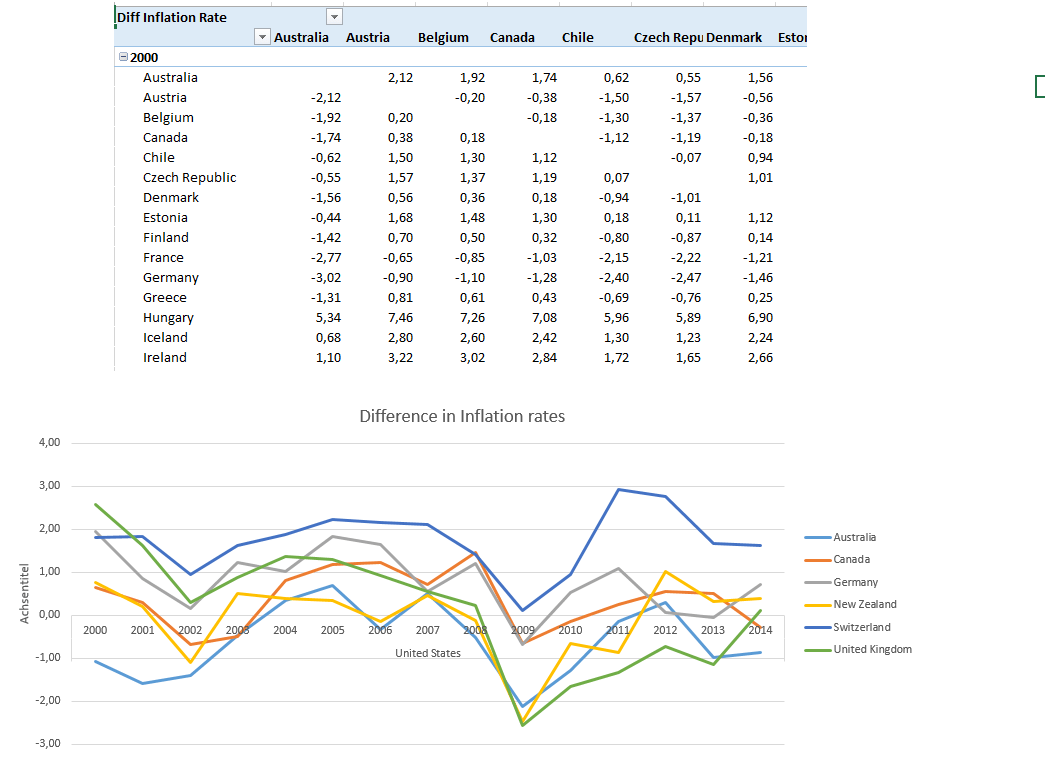
How to compare everything with everything using Power BI or Power Query


A question in Mr. Excel-Forum about how to design your data model if you want to compare values from 10 different (fact-) tables with each other got me curious: As this simply felt so wrong… and where there are 10 tables today, there will be probably be 12 tables next …?

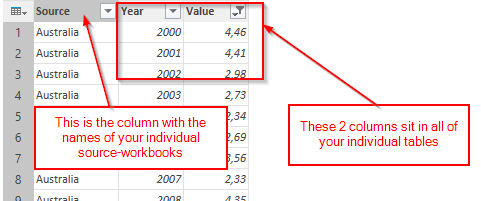
Time for Power Query to play out its strengths on dynamic approaches then: Key is to create one consolidated table from all the different input-tables with an additional column that contains the name of each source table.

If your data sits in Excel tables, you can find the description on how this works in the new Power Query book from Ken Puls and Miguel Escobar, starting on page 47 (key is to keep the name-column!).

In my example I’m using web-data that already has the format of a consolidated table, comparing inflations rates of different countries with each other. So the data-structure looks like this:

1DataStructure

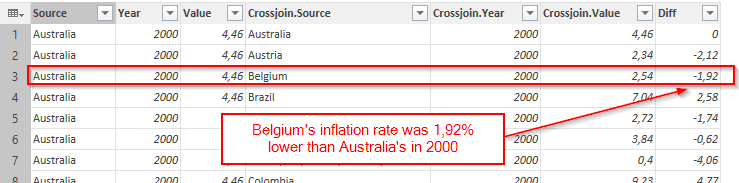
You then start a new query that refers to your source data and merge it with the source again on the year-column. The year-column shall stay the same, as we don’t want to compare different years against each other, but only different countries (Sources).

This will actually create a crossjoin of all countries against the country in the respective row – but within the same year. Last step is to create an additional column that calculates the difference between the values. This tells you how the inflation rate of the country to compare against is in relation to the source-country:

2Table

& this is the code:

Read more