How to hack yourself in Power BI (and Power Pivot?)

Reading Gerhard Brueckl’s post on how to visualize SSAS calculation dependencies reminded me of my post about a similar technique from December last year.

His solution has features that would do my version good as well:

  1. Directly connect to the model to be analysed without clumsy export of measures to txt via DAX Studio
  2. Including calculated columns? No!: Who does calculated columns in DAX in PBI? Do them in the query editor using M instead (more functions, better compression, easier merge of model to SSAS once needed)

So wouldn’t it be cool if we could just add a documentation page to our current model – “all in one” so to speak? Here you find how to “hack”-connect with Excel to your current Power BI Desktop-Model.

So what works with Excel should work with PBI as well – just that we need to connect via the query-editor, using M. And of course: As we’re hacking ourselves here (i.e. the file we’re currently working on), we need to save our changes in order to make them being shown.

Read more

How to handle M-code samples

If you use Power Query or the query editor in Power BI every step you take will be recorded and translated to M-code. You can share this code and it will run in the new environment – so no need to actually exchange a file.

1 Check out what the M-code does

In order to make this code-sharing easy for beginners, I’m sharing my code in a way that it will run instantly with the test-data provided within the code. So you just copy my code examples into the advanced editor like this (example given for Power BI):

Home -> External Data -> Get Data -> Blank Query -> Home -> Query -> Advanced Editor.

There you replace all the content in the window: Check existing content, paste and click Done.

PasteCode

That’s all, now check out how it works: On the Home-tab check Close -> Close & Apply. This will load the data to the data model and you can build your reports with it.

2 Check out how the M-code does it

Read more

Trap in Replacement function in Power Query/M/PowerBI

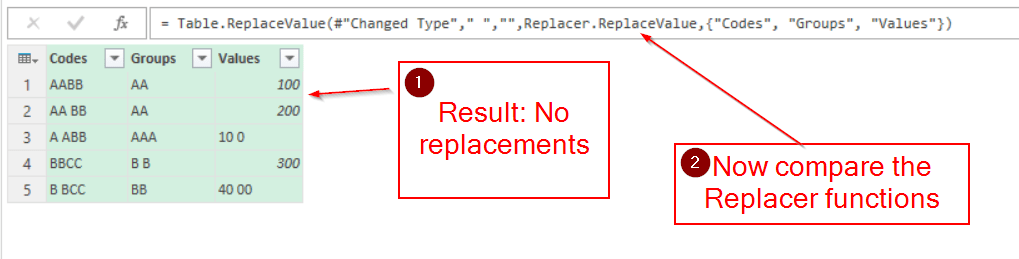
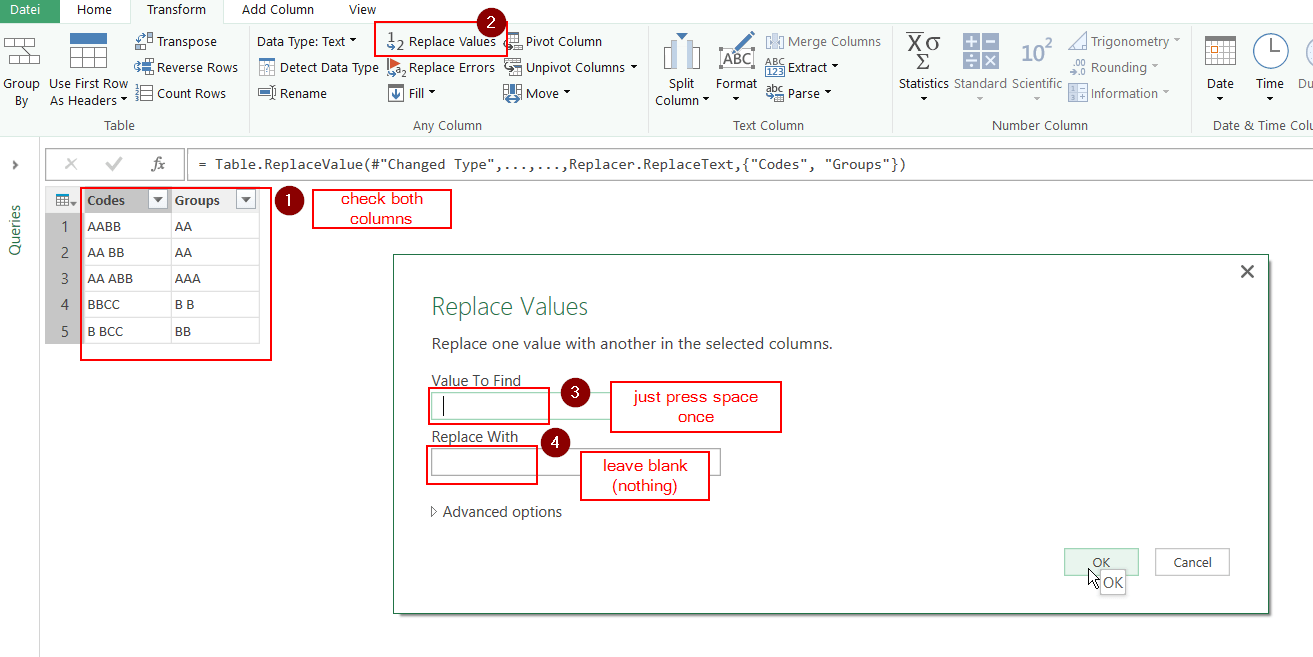
Recently Power Query’s replacement function greeted me with some unexpected results: I applied the same steps but sometimes replacements of blanks with nothing did what it should and sometimes not.

What was going on?:

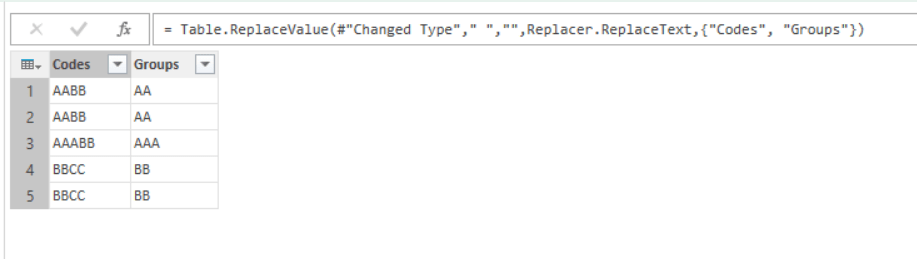
Starting with a table with 2 columns like this:

Image1

The results came out as expected, blanks were removed by nothing, so all gaps closed:

Image2

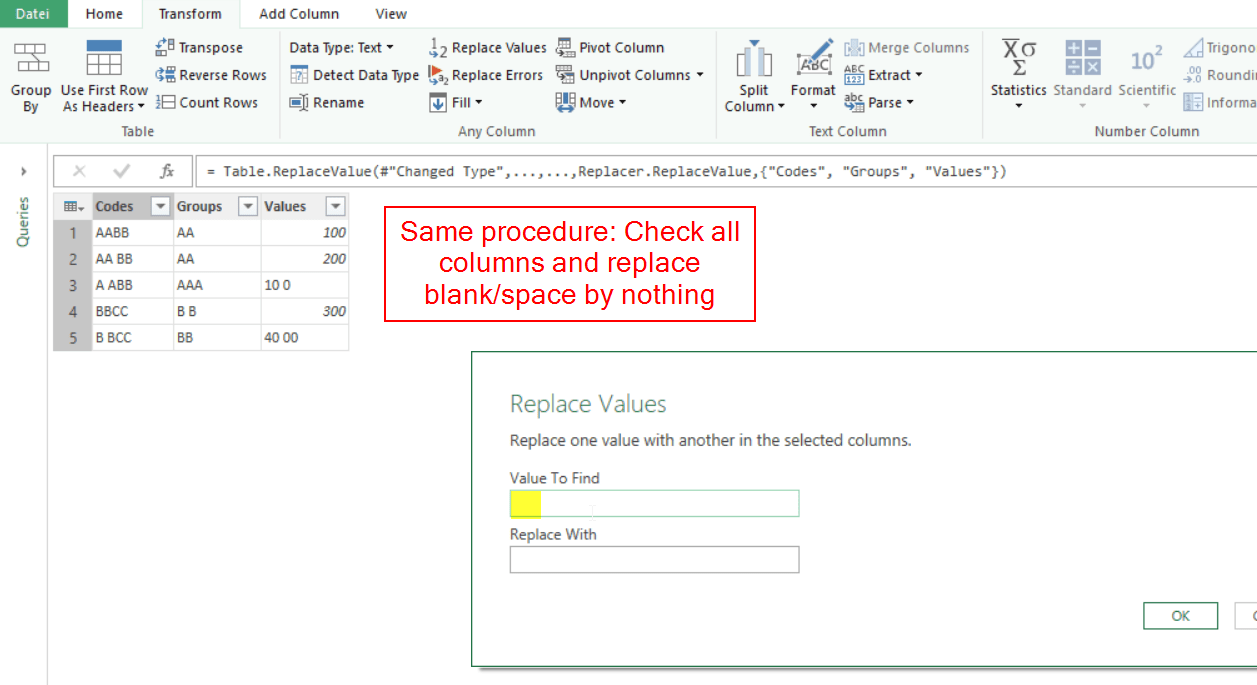
Then I added the Values-column like this and applied the same steps as above:

Image3


Image4

Read more

Visualize query dependencies in Power BI with Sankey diagram

Edit 7th August 2016: You’ll find an easier “OneInAll”-approach in the PowerBI forum here. Thanks to David Moss for reporting an issue with the solution below.

PBI-file with new query: NewAllInOneCode.zip ,

How to use:

Old post:

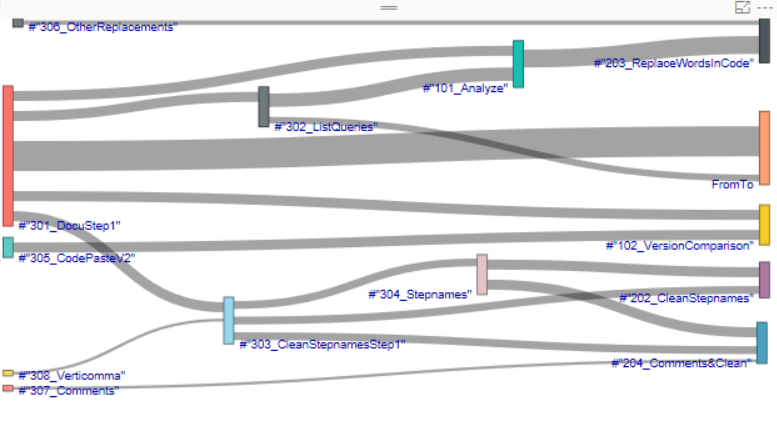
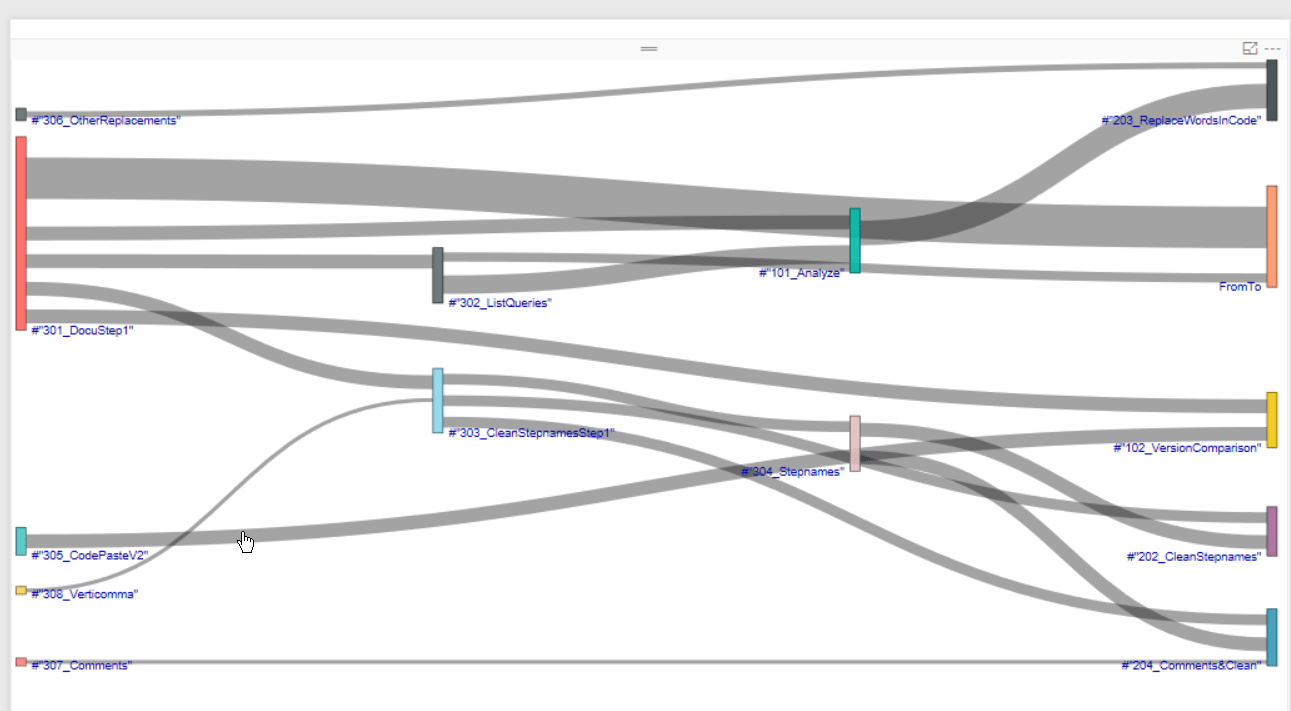
This week we got a new Sankey diagram. It has some advantages when visualizing dependencies between items/nodes, one being not to cut the labels. Time to share a tool that I use a lot when working with complex M-queries (in Power Query or Power BI). It shows how the queries are connected with each other:

Image1
Sankey diagram default

Left stand the queries who fetch the source data, parameters and/or user defined filters, then you see how they get transformed until to the right you see the queries that deliver your end-results. Especially when working with codes that has been written by someone else I find it very useful to get a quick oversight of what’s happening – as an excellent complement to the documentations 🙂

You can also move the nodes around to improve readability:

Image2
Sankey diagram with adjusted nodes

Read more