Here comes some long awaited comfort functions for part 2 of my easy P&L series. In the first section I’ve presented the general principle on how to work with a structure using an accounts-group-table. Today I will present 2 alternatives to define the reports without specifying single accounts. So if a new accounts are added to the chart of accounts, you don’t have to adjust your report definitions: Just make sure that to fill in all the fields in your account-group-table and you’re ready to go 🙂
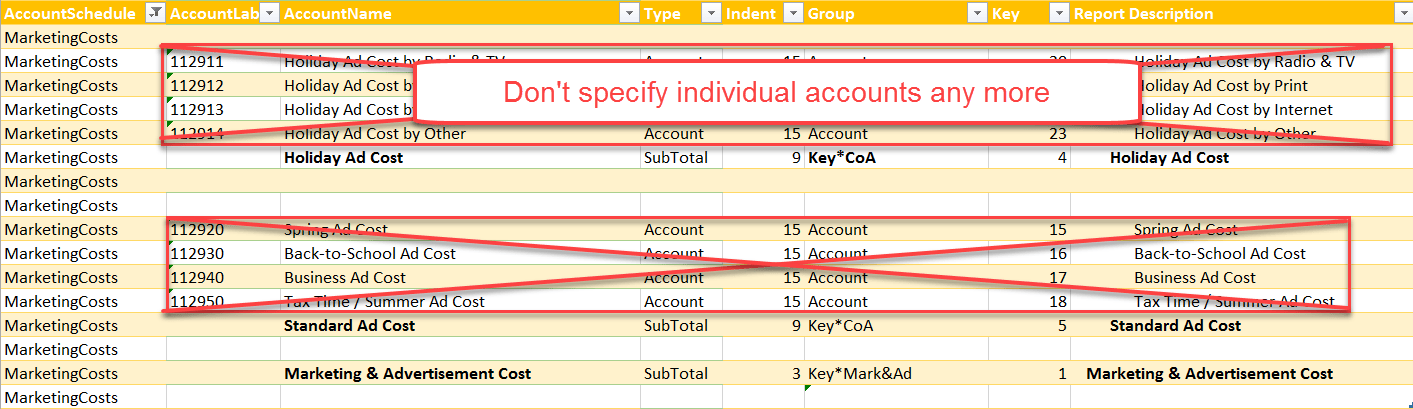
No need to specify single accounts
So you only need to adjust your report definitions if you add new group items. If that’s still too much, take the 2nd solution, which will even eliminate that requirement:
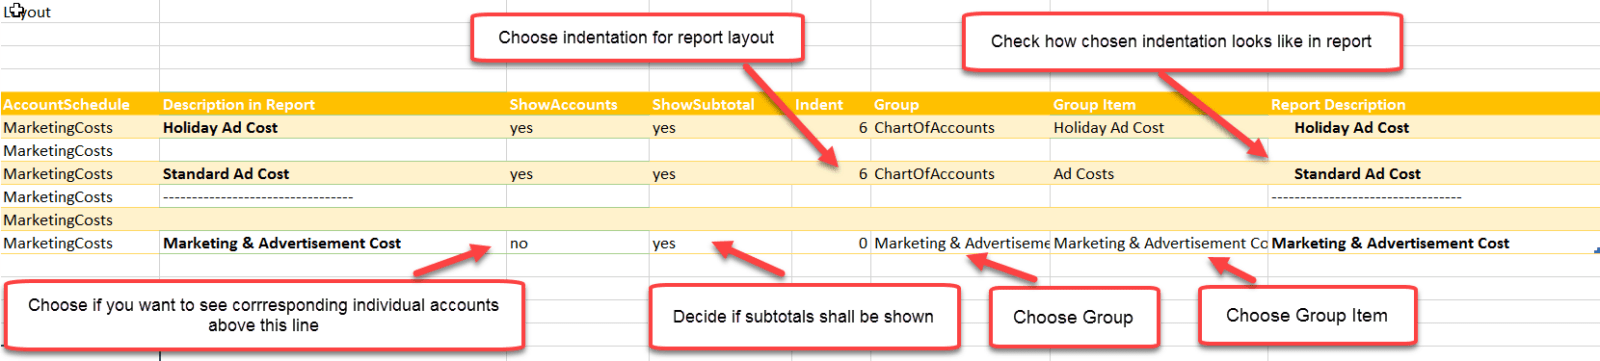
- Individual Account Layout: Just define each subtotal and determine for which subtotals single accounts shall be shown
How to use it:
2. Ultrashort Account Layout: Further simplification of just defining the groups (hierarchy) that shall be shown (with option to filter on one of them)
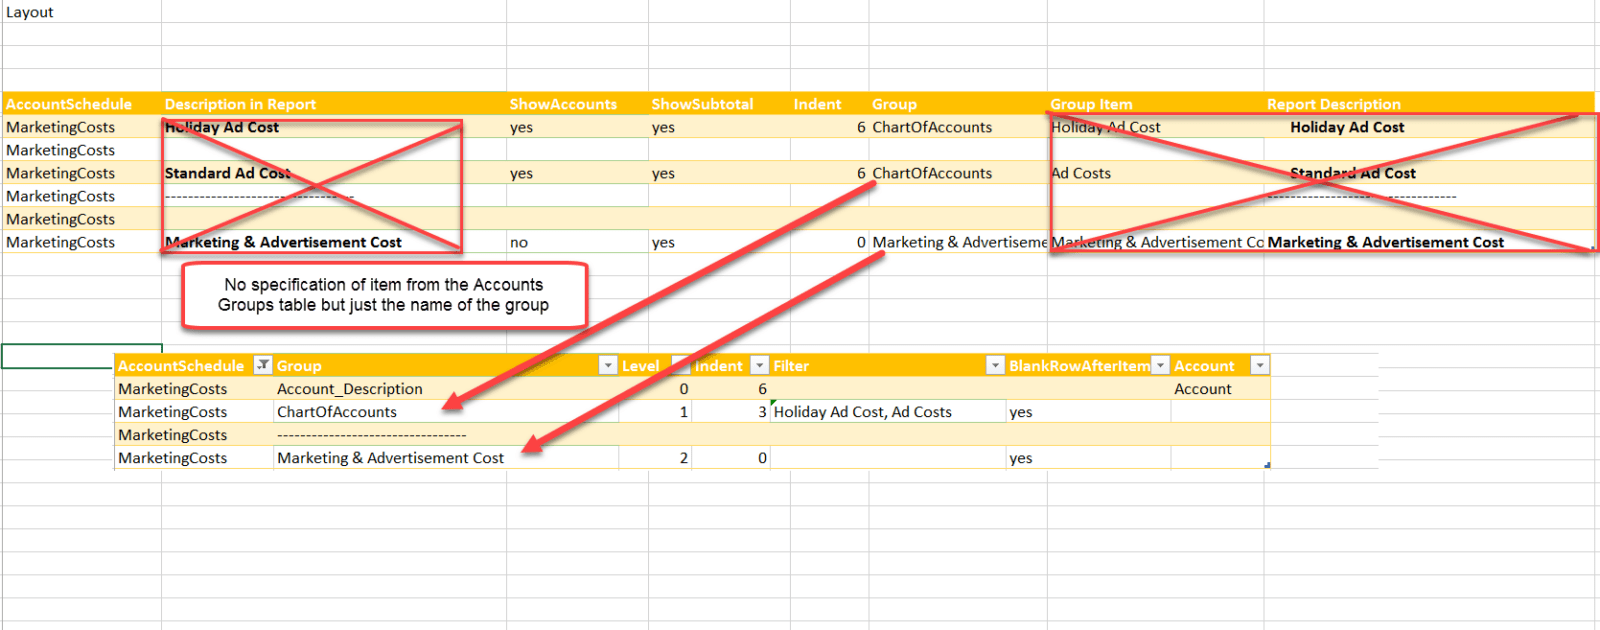
How to use it:
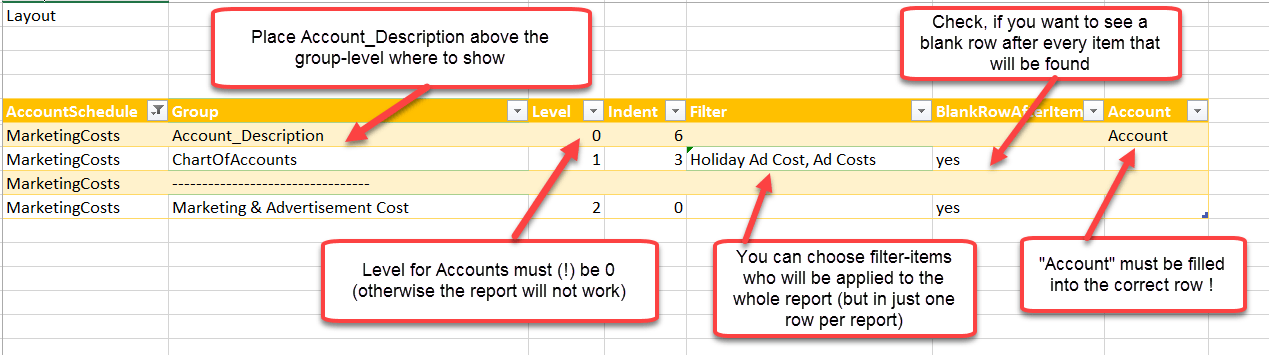
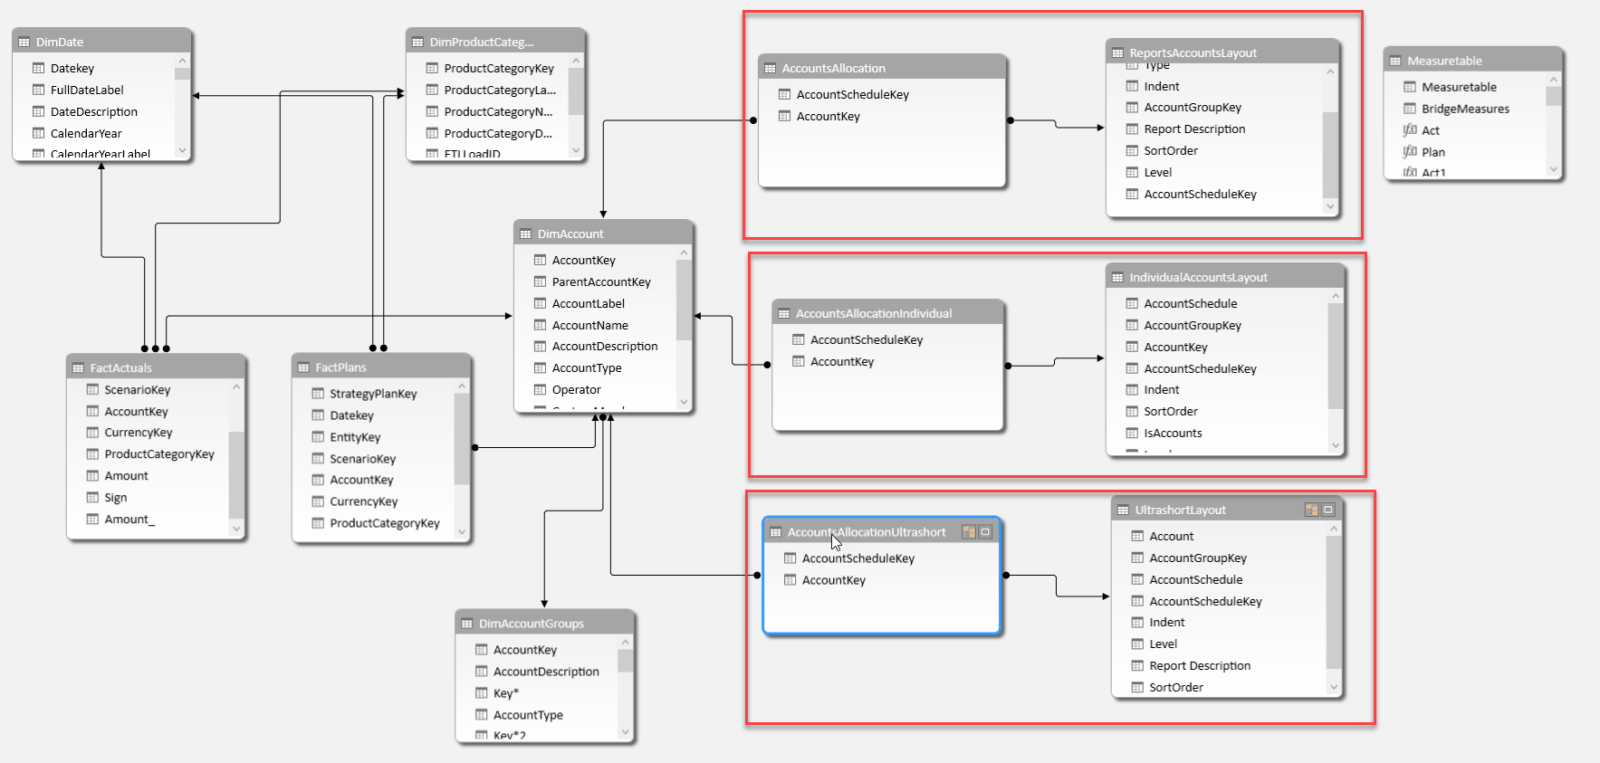
So these 2 different layouts will both produce the same reports incl. all accounts – just like in the first example. So you can choose which layout-style suits you best – actually, you can use all 3 in parallel. You just have to make sure to grab your pivot-rows from the correct tables and in Excel to grab the matching measures, as they all have their own bridge-tables (which need to be used in the measures):