Advanced type detection in Power BI and Power Query: Table.ClassifyMixedColumnTypes

This is not a proper blogpost, just a quick share of a function I’ve created today which I think will be very useful for others as well: Automatic type detection will assign only one type to a column, but sometimes there are multiple types in it and then the type “any” will be applied, which means no … Read more

Multiple replacements or translations in Power BI and Power Query

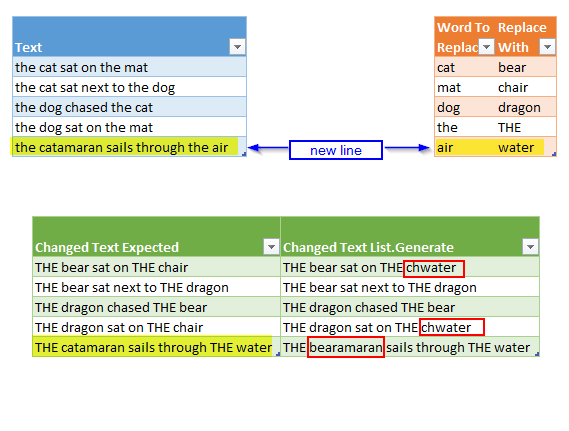
A common task when cleaning data is to perform multiple replacements at once. When dealing with “translation tables” you might have come across Chris Webb’s solution using List.Generate to deal with this. This works fine – but might deliver unexpected results if you don’t consider it’s implications properly. Say we add lines like shown below, then we might expect the result as highlighted in yellow:

Image2
Multiple replacements using 2 different techniques

So hey – what happened here?: Our catamaran turns out as a bearamaran and the chair turns to chwater.

Read more

Select rows that have no empty fields using Expression.Evaluate in Power BI and Power Query

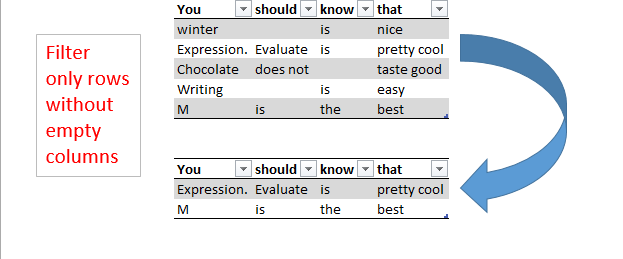
This article describes the use of Expression.Evaluate as a very helpful “swiss-army-knife”-method for your Power BI toolbox as it has many more use cases than the one described below. It lets you perform repeating tasks without using functions and can even replace recursive operations in some cases – but that’s a topic for a later blogpost. Today we start with a simple task:

If you want to filter rows only where none of the fields/columns are empty, you’d either pass not-null filters into every single column (which is tedious and not dynamic), transpose or add an index column, unpivot and filter from there (both might drag performance down on large tables).

Using Expression.Evaluate will create a dynamic approach that doesn’t force you to transform your source table nor to directly specify your column names: It will take in a text string and execute it as if you’ve been written it manually into the formula. If you manage to let this textstring be created dynamically according to the different tables you’re going to pass in – Expression.Evaluate will make sure that these individual statements will be executed accordingly.

So for a table containing Column “A” and Column “B” the filter statement would look like this:

Read more

How to use regular charts on dynamic pivot tables in Excel

There are many good reasons not to use Pivot charts as described in this article i.e. – one I would like to add is the bug when using “invert if negative”: The inverted colour will disappear once you refresh your data.

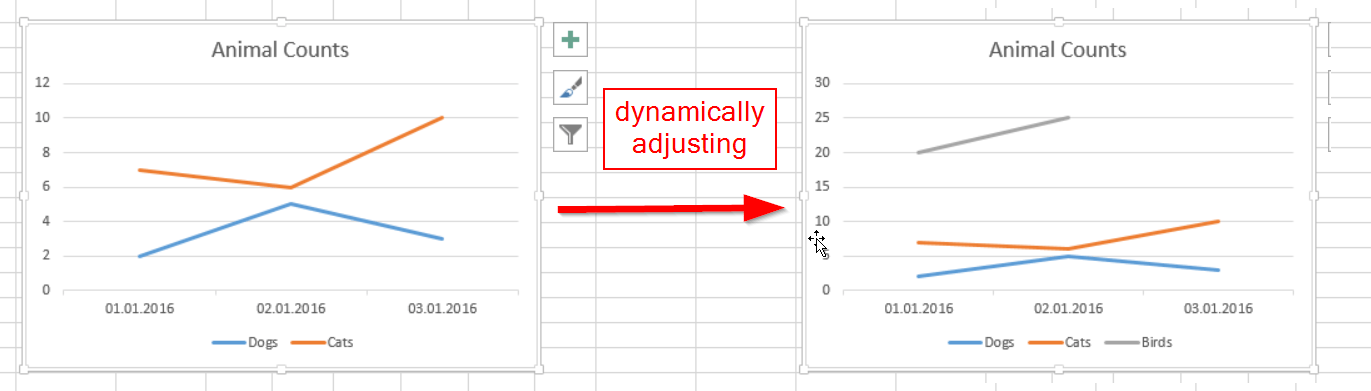
If you use Power Query to create the pivot for your chart, a regular chart will be created on it: Gone are the restrictions that come with the Pivot-Chart and it will also adjust dynamically to new or deleted rows and/or columns.

How to create your regular charts on dynamic pivot tables:

Read more