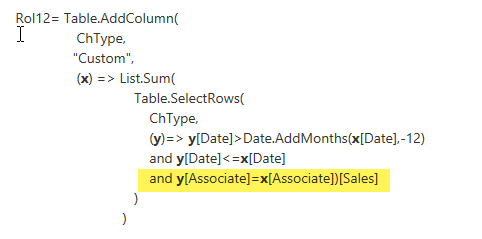
To improve performance you can check if there is a chance to “partition” your table using a Table.Group. If you have an equality expression in your statement like we had in our rolling-12-months-exercise here for example:
You can boost performance into a different dimension by grouping your table on the “Associate”-table instead like this:
I knew that the performance of M in the query editor of PowerBI was much better than in Excel, but only today I discovered the incredible difference we actually have here:
If you want to apply the BOM-solution I’ve posted here, you’ll soon discover that the performance in Excel starts to suck with large datasets. Performance decreases exponentially and my sample datasets with 4 levels and 100k rows didn’t went through, 16 GB RAM constantly at the limit, unable to do any other task at the same time.
In contrast, performance in PowerBI totally blew me away: Memory management is different. Rise in RAM-consumption was always below 3 GB, even with my largest dataset (a 5-level 1Mio (!) rows BOM table that exploded to 3,8 Mio rows). Also no sweat in CPU, so I was able to easily perform other tasks at the same time on my laptop.
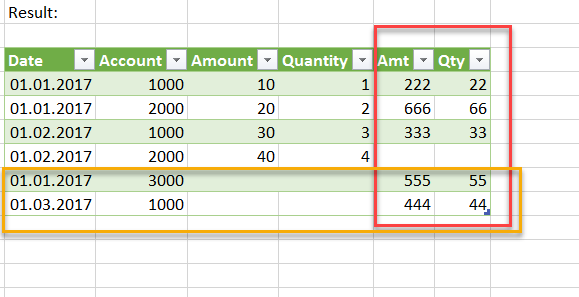
Today I came across a question in the PowerBI-forum if blending data was possible in Power BI like in Tableau. Although I wouldn’t necessarily recommend it, it’s definitely is a nice challenge. So the following function will interlace the rows from 2 tables like the blending-function in Tableau does. Just that we cannot use any aggregators … Read more
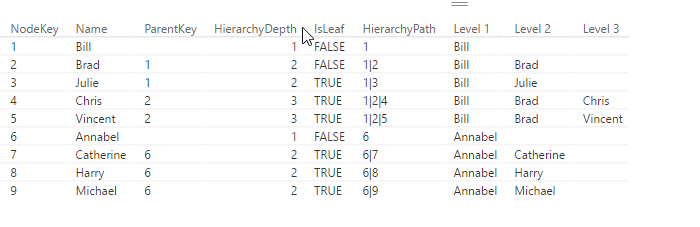
If you use DAX to flatten Parent-Child hierarchies you will end up with a table that has a static number of columns (like described here). If you need a dynamic solution instead, which creates just as many level-columns as there are needed for the current data, you can use DAX’s helper-tool Power Query (or Get Data in Excel) or the query-editor in PowerBI, which uses the language M.
Another advantage of this solution is that you can script the table creation in one step (only flaw: You still need to manually adjust your hierarchy though): But it saves time in creating the table, especially if you have many levels.
Update 2017-Dec-2: It also handles multiple parents now.
2 simple steps to flatten Parent-Child Hierarchies
copy the following function,
add a new step to your current table where you call this function, filling in the following parameters:
table name (which is the name of the previous step in your M-query)
name of the column with the child-key
name of the column with the parent-key
name of the column who’s values shall be shown in the levels (can also be child-key)
Call fnFlattenPCHierarchyFunction
Endless loops
If the relationships in your data are ambiguous, i.e. items stand in parent-child as well as child-parent-relationship to each other, and endless loop would occur. The newest version (V2 upwards) caters for this possibility and will generate a warning and return only the rows that are subject to the endless loop to examine.
Edit 7th Feb 2017: Friendly reader Roknic pointed out in the comments below that there’s actually an existing function for it in M: Table.TransformColumnNames 🙂
So the first of my example below would actually look like this:
Table.TransformColumnNames(Source, each Text.Replace(_, " ", "_"))
But still keeping my original post here, as the transformations in them might help for other use cases:
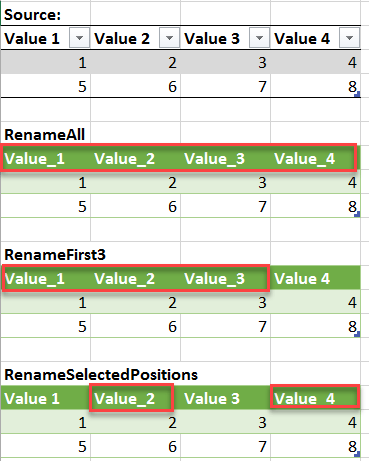
If you want to rename all of your table’s columns with a common rule, like “replace all spaces by underscore” or just “delete all spaces”, check out this easy method:
The above formula will replace all spaces (” “) by underscores (“_”).
How does it work:
The 2nd argument in the Table.RenameColumns-formula is a list of lists, just like in Table.TransformColumnType from this article. So we apply the same technique here: List.Transform transforms a single element from a list into a list-item, whose 2nd argument will be calculated with a Text.Replace-function.
Variations:
Rename Columns Variations
Only replace FirstN or LastN elements from the column names: