I knew that the performance of M in the query editor of PowerBI was much better than in Excel, but only today I discovered the incredible difference we actually have here:
If you want to apply the BOM-solution I’ve posted here, you’ll soon discover that the performance in Excel starts to suck with large datasets. Performance decreases exponentially and my sample datasets with 4 levels and 100k rows didn’t went through, 16 GB RAM constantly at the limit, unable to do any other task at the same time.
In contrast, performance in PowerBI totally blew me away: Memory management is different. Rise in RAM-consumption was always below 3 GB, even with my largest dataset (a 5-level 1Mio (!) rows BOM table that exploded to 3,8 Mio rows). Also no sweat in CPU, so I was able to easily perform other tasks at the same time on my laptop.
After the great announcement yesterday that we will be able to ship custom functions within the shared environment, I’m expecting a lot of people starting to write awesome custom functions for M. Hopefully they will all have nice function descriptions/metadata shipped with them, that makes it as easy as possible for users to apply them correctly:
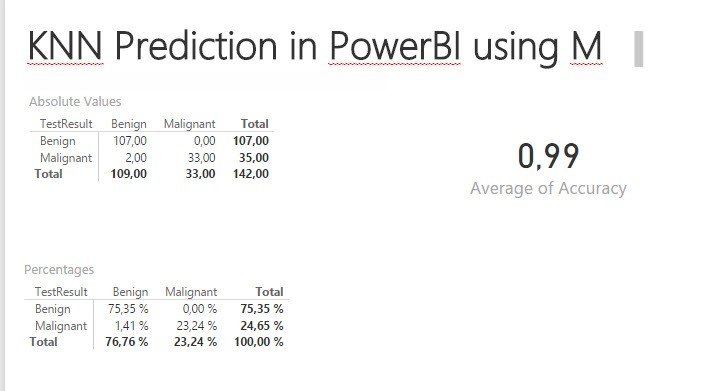
Very often I have thought about trying M instead of R for machine learning problems in PowerBI. Not only because I’m such a big fan of M, but also because we don’t have the R-integration in Excel (yet?). Leila Etaati’s brilliant series of how to use R in PowerBI for KNN-prediction (nearest neighbourhood) finally kicked … Read more
Reading Rob Collie’s latest cool blogpost on how to retrieve slicer selections in Power BI, I couldn’t stop thinking of how awesome it would be, if we could use this technique to pass slicer selections as query parameters to the M-queries in the query editor. Not only would we have a very convenient user interface, … Read more
In finance & accounting, you very rarely report the figures with the signs of their source systems, but switch (certain) signs according to different needs. Instead of using unary operators for it, I’ll present an easy and dynamic way for it in Power BI and Power Pivot using DAX. It will cover the following 3 main scenarios:
1_SwitchAll: All signs are switched (red)
2_SwitchExpLiab: Expenses and liabilities are switched back to their original values (green)
3_BWT_Indiv: Only the main figure for expenses (or liabilities) carries a minus, all following positions specifying the expenses are (principally) reported as positives (blue)
Switching signs in Power BI and Power Pivot without unary operators
I’m using the sample data from this article but changed the source-data to a double-bookkeeping structure. There signs are used and the transaction entries in your ledger table always add up to zero. This is a method that prevents errors when posting and can also be used to prevent errors in reporting. If you keep the signs in your reporting system, all you have to do is add up the relevant figures and the returned (absolute) figures will always be correct. If you have read my previous articles on Easy P&L, you have seen this method in action: No minus-operation there, just a simple stupid adding of all accounts who fall into several (sub-) total categories via the bridge-table.
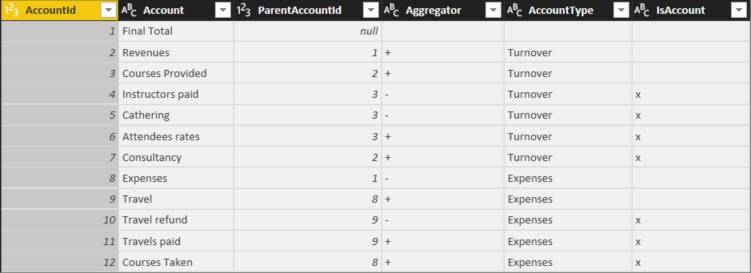
The Account-table also contains of (sub-) totals and the column “AccountType” shows if the positions are regarded as Turnover (Revenue) or Expenses:
Table “Accounts”
1_SwitchAll
My values on “1_SwitchAll” corresponds to “FinalValue” in the article above. The revenues come from consultancy and coursed provided. But the revenue for courses don’t just consist of attendee rates, but the costs for catering and paid instructors shall be deducted (highlighted in yellow). So the “good” numbers that contribute to cash in your pocket shall be reported without a sign and the “bad” numbers that result in an outflow of cash shall be reported with a minus. Within the expenses category, the costs carry a minus and the travel refunds (highlighted in orange), which are cash positive, are reported as positives.
2_SwitchExpensesLiabilities
Another requirement that is often used for balance-sheet-reporting or reports that only report on cost-situations, require that the costs or liabilities are reported without signs. … Principally, because the reimbursements/cost deductions shall be reported with an opposite sign (to show the adverse effect to the cashflow). This is what “2_SwitchExpLiab” shows (not covered in the article).
3_BWT (“BossWantsThat”)
Last but not least comes a typical “BossWantsThat”-requirement: Basically some strange stuff that you just have to deliver. Here the main categories “Revenues” and “Expenses” shall be shown with the signs that reflect the cash-direction, but all specifications that follow below shall be reported without signs (again: Principally, because positions with opposite cash-effects than the main category shall carry inverted signs).