How to share M-code in PowerBI and Power Query

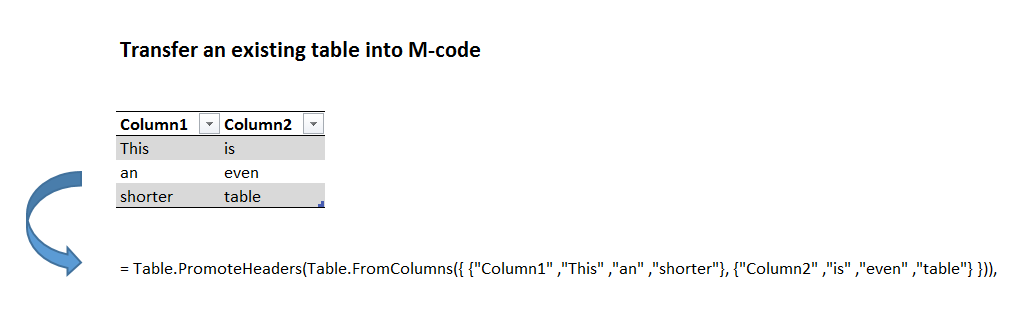
One of M’s advantages is that you can share M-code in textform and it will run instantly on a different computer. So no need to actually exchange a file. Provided that you pass the data on as well with your code, like you can see in this example.

But it would be a bit tedious to type in all the data manually – so let’s M do this automatically for us:

1 Automatically transfer a list into textform to share M-code

let
qList= {"This", "is", "a", "pretty", "short", "list"},
Source = qList,
CoreString = Text.Combine(List.Transform(Source, each Text.From(_)), """, """),
FullString = "= {"""& CoreString &"""}"
in
FullString

2 Automatically transfer a table into textform to share M-code

let
qTable= Table.PromoteHeaders(Table.FromColumns({ {"Column1" ,"This" ,"an" ,"shorter"}, {"Column2" ,"is" ,"even" ,"table"} })),
Source = qTable,
DemoteHeaders = Table.DemoteHeaders(Source),
ListOfColumns = Table.ToColumns(DemoteHeaders),
ConvertToTable = Table.FromList(ListOfColumns, Splitter.SplitByNothing(), null, null, ExtraValues.Error),
CoreString = Table.AddColumn(ConvertToTable, "Custom", each Text.Combine(List.Transform([Column1], each Text.From(_)),""" ,""")),
FullString = "= Table.PromoteHeaders(Table.FromColumns({ {"""& Text.Combine(CoreString[Custom], """}, {""")&"""} })),"
in
FullString

Read more

How to handle M-code samples

If you use Power Query or the query editor in Power BI every step you take will be recorded and translated to M-code. You can share this code and it will run in the new environment – so no need to actually exchange a file.

1 Check out what the M-code does

In order to make this code-sharing easy for beginners, I’m sharing my code in a way that it will run instantly with the test-data provided within the code. So you just copy my code examples into the advanced editor like this (example given for Power BI):

Home -> External Data -> Get Data -> Blank Query -> Home -> Query -> Advanced Editor.

There you replace all the content in the window: Check existing content, paste and click Done.

PasteCode

That’s all, now check out how it works: On the Home-tab check Close -> Close & Apply. This will load the data to the data model and you can build your reports with it.

2 Check out how the M-code does it

Read more

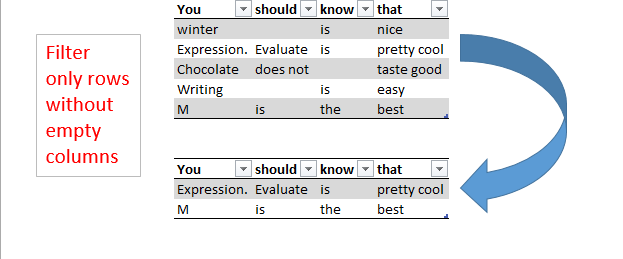
Select rows that have no empty fields using Expression.Evaluate in Power BI and Power Query

This article describes the use of Expression.Evaluate as a very helpful “swiss-army-knife”-method for your Power BI toolbox as it has many more use cases than the one described below. It lets you perform repeating tasks without using functions and can even replace recursive operations in some cases – but that’s a topic for a later blogpost. Today we start with a simple task:

If you want to filter rows only where none of the fields/columns are empty, you’d either pass not-null filters into every single column (which is tedious and not dynamic), transpose or add an index column, unpivot and filter from there (both might drag performance down on large tables).

Using Expression.Evaluate will create a dynamic approach that doesn’t force you to transform your source table nor to directly specify your column names: It will take in a text string and execute it as if you’ve been written it manually into the formula. If you manage to let this textstring be created dynamically according to the different tables you’re going to pass in – Expression.Evaluate will make sure that these individual statements will be executed accordingly.

So for a table containing Column “A” and Column “B” the filter statement would look like this:

Read more

How to use regular charts on dynamic pivot tables in Excel

There are many good reasons not to use Pivot charts as described in this article i.e. – one I would like to add is the bug when using “invert if negative”: The inverted colour will disappear once you refresh your data.

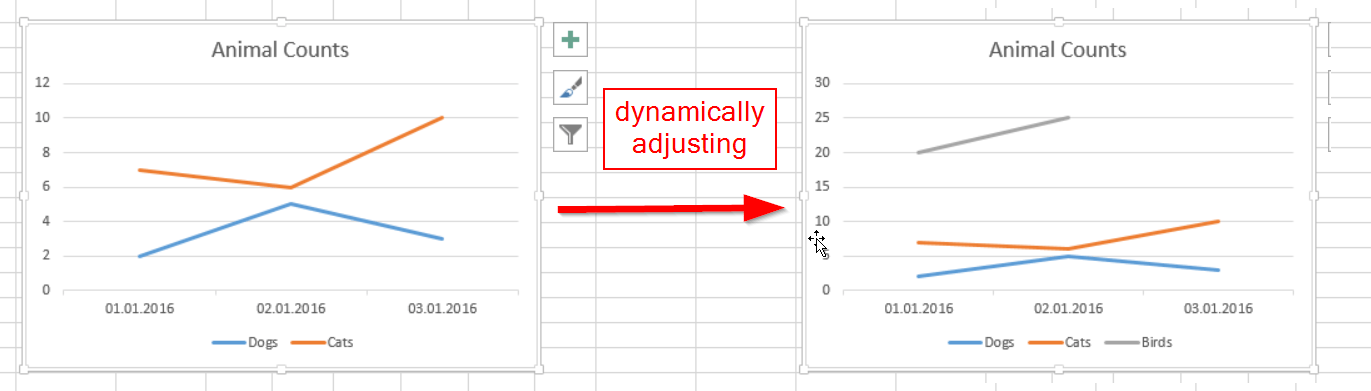
If you use Power Query to create the pivot for your chart, a regular chart will be created on it: Gone are the restrictions that come with the Pivot-Chart and it will also adjust dynamically to new or deleted rows and/or columns.

How to create your regular charts on dynamic pivot tables:

Read more

How to create a Load History or Load Log in Power Query or Power BI

If you want to collect your regularly loaded data without overwriting it or create a load log that writes the load activites with a timestamp into a table, you need to create a query that adds new lines to it’s own latest version.

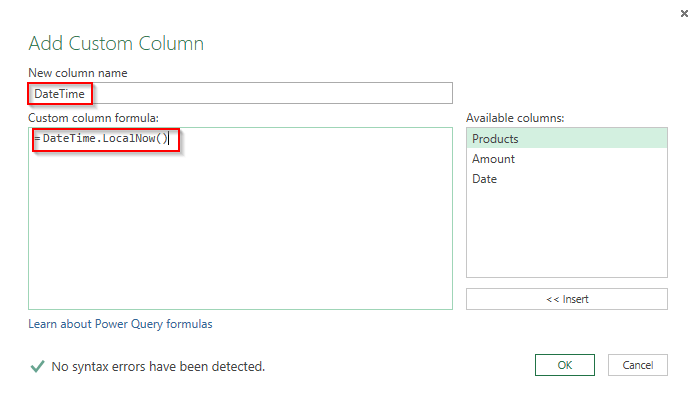
In both cases you add a column that returns the current day and time using DateTime.LocalNow()

Image1

Load Log the PowerBI-way

Then using Power BI it’s fairly easy: Use the R-extension to perform an append query to the external txt or csv-file like described in this post (incremental load):

require(gdata)
write.table(trim(dataset), file=”your filepath & filename.txt”, sep = “\t”, row.names = FALSE, append = TRUE, column.names=FALSE)
plot(dataset);

Load Log the Power Query-way

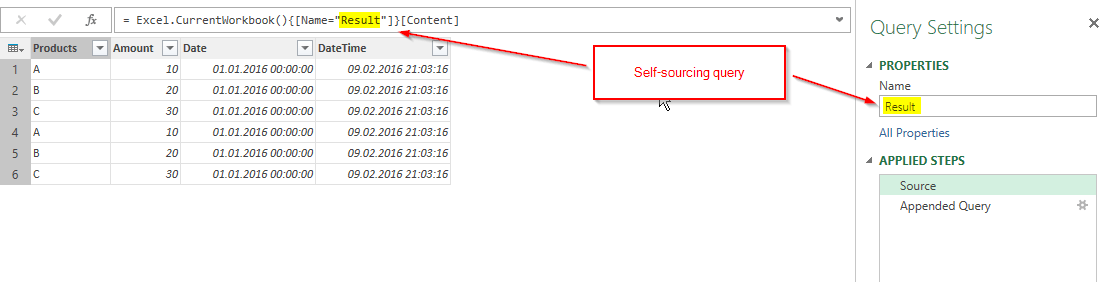
In Excel’s Power Query it’s a bit trickier, because you cannot export your queries and therefore need to create the consolidated table in your workbook itself. And it must be a self-referencing query or to be more precise: a self-sourcing query: A query that takes its latest output as its new input, then appends the new data and overwrites the old result with the new one.

How do we deal with this? When we write the query we don’t have the result yet to be referenced?

Read more

Trap in Replacement function in Power Query/M/PowerBI

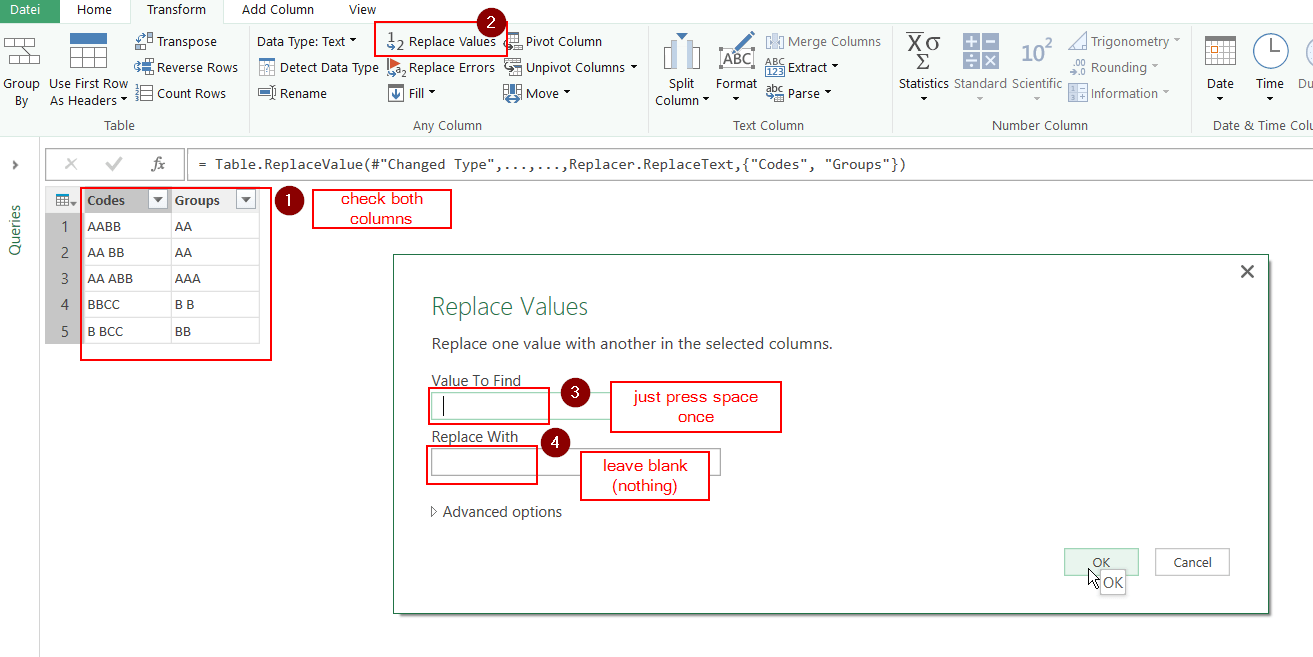
Recently Power Query’s replacement function greeted me with some unexpected results: I applied the same steps but sometimes replacements of blanks with nothing did what it should and sometimes not.

What was going on?:

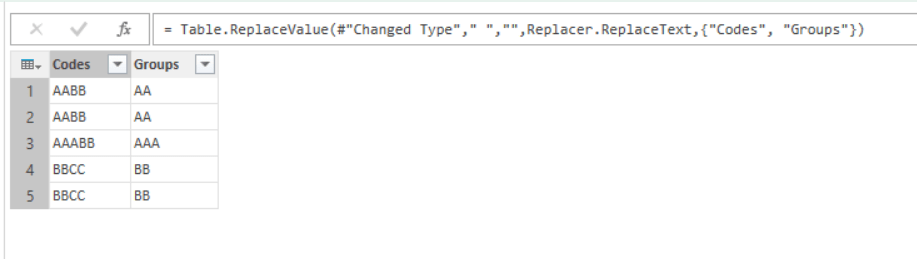
Starting with a table with 2 columns like this:

Image1

The results came out as expected, blanks were removed by nothing, so all gaps closed:

Image2

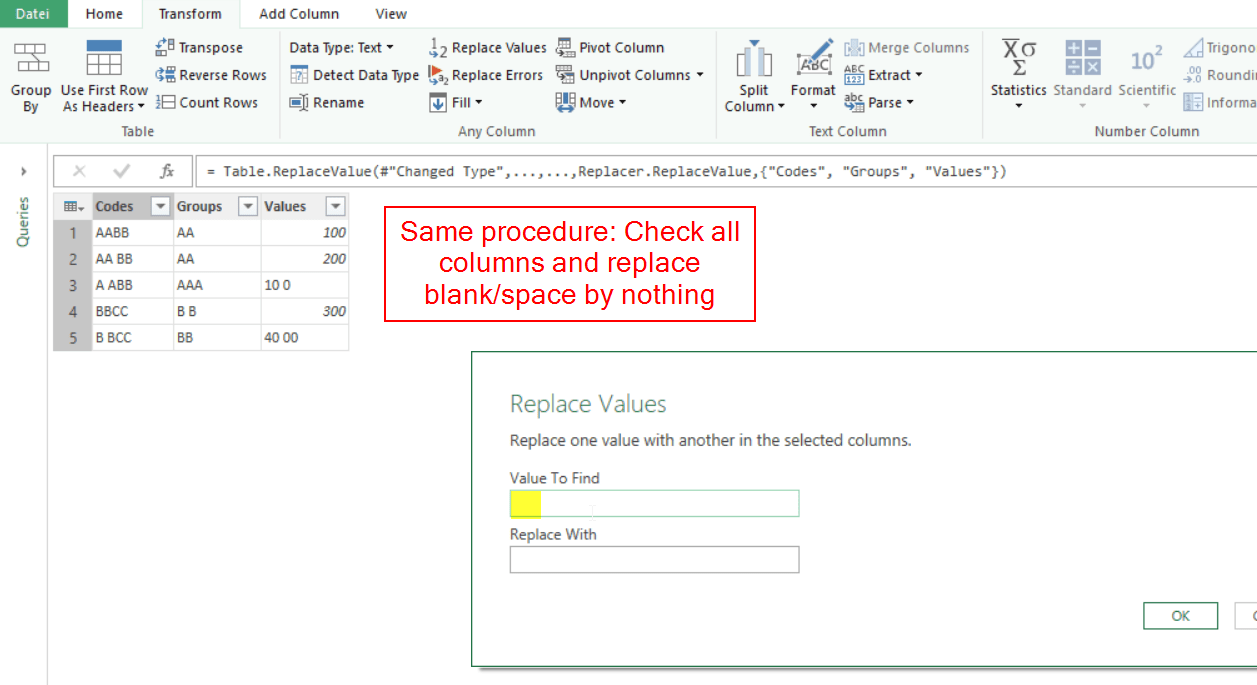
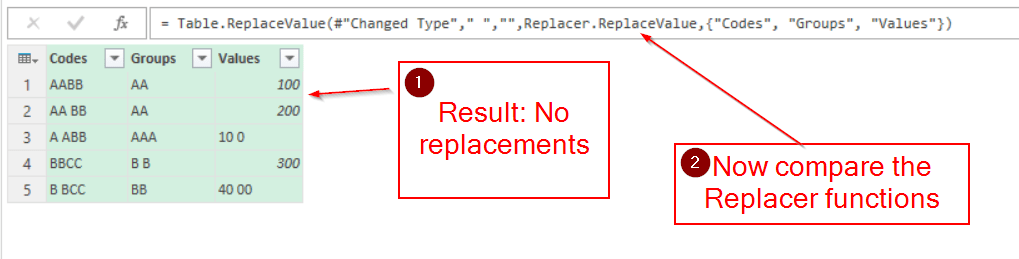
Then I added the Values-column like this and applied the same steps as above:

Image3


Image4

Read more