Dynamic Power Query X-mas tree in Excel

Wishing my faithful readers peaceful and happy holidays. Hope you enjoy my jumping Power Query X-mas tree: It changes his size or decoration randomly every time you press refresh: Totally auto-M-agically 😉 (No macros and no Excel formula in any cell ! ) Just 6 lines of code and 2 formatting conditions return a table with dynamic size. … Read more

How to store tables longer than 1,1 Mio rows in an Excel-sheet using Power Query and JSON

If you are working Power Query, you might come into a situation where you would like to make tables accessible from outside that file, that are longer than the 1,1 Mio rows who fit into an Excel-sheet. You can do that using the JSON-format and compression. That way you create a table in Excel that contains a JSON-text string, that can then be read and decoded again by Excel (or Power BI), using Power Query (or Get&Transform in Excel 2016).

You can download the file where a table with 2 Mio rows is compressed into a table with just 229 rows here: JSON_BreakRefreshChain4.xlsx

Simple idea:

Convert your table into JSON using the Json.FromValue-function. If we could export that JSON-file from here, we would be done already. But I haven’t figured out yet, if/how one could export or copy that from within the query-editor (apart from manual copy& paste, but that has also a limit of our good 1 Mio characters here). So if you have any idea about this, please share.

Workaround:

Read more

How to tame Case Sensitivity in Power Query and PowerBI

Have you heard of “Comparer.OrdinalIgnoreCase”?

If the answer is “No” (or something similar), you will be very delighted to hear that this is your key to disable case sensitivity in comparing operations.

So if you want to check if a substring like “car” is contained somewhere, you can write:

Text.Contains(MyText, "car", Comparer.OrdinalIgnoreCase)

and the expression will return true for all cases of car like: CAR, Car, caR… .

The official documentation looks like this:

Read more

Easy Profit and Loss and other (account) scheme reports in Power BI and Power Pivot using DAX

This is about an easy way to create typical finance reports like Profit and Loss using DAX that (unlike all other solutions I’ve come across so far) can be handled with very basic knowledge of this language like this:
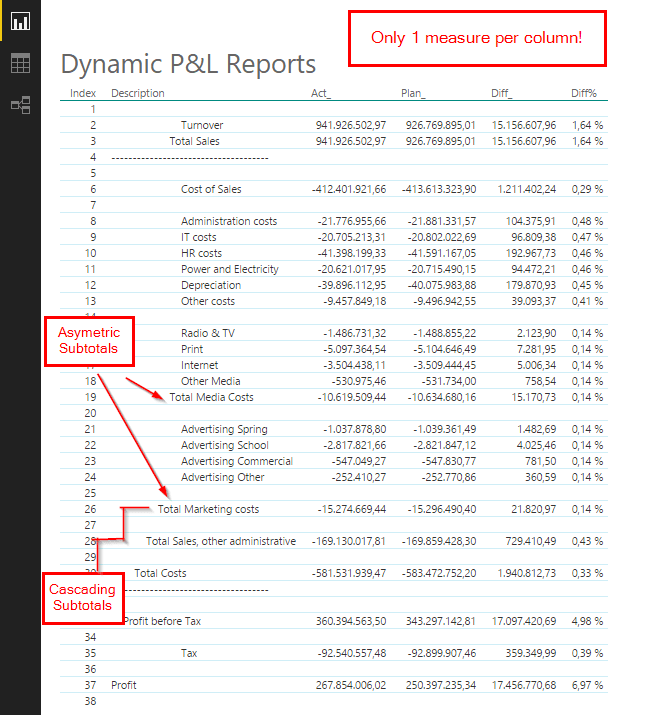
Image1

The trick

The trick that makes my solution so easy lies in the fact that it requires no aggregation functions of the output-mediums like:

  • pivot-tables: who struggle with asymetric logic and are not available in Power BI so far
  • cubefunctions: who are not available in PowerBI so far

So we have to build the details as well as all aggregations into the solution as it is and don’t rely on/use any aggregation functions (This means for Excel: We have to turn off subtotals as well as totals in our pivot tables. It means for Power BI: Hurray! Finally a solution where the lack of pivot-tables doesn’t matter).

How to

The aim is to create a table/matrix with (account) details and aggregations into the rows and different slices of time-Intervalls or comparisons into the column sections. As for the columns, this will be covered by measures like [Actuals], [Budget], [PreviousPeriods], [Differences in all shapes…]. And – as the values in the columns should be the same – I’d prefer to use only one measure per column – that is fully sliceable and works on all (sub-) totals of course. … Ok – so some dreams later I found it:

MyMagicMeasure := CALCULATE([StandardMeasure], AccountsAllocation)

So you just wrap simple measures like Act=SUM(Fact[Amount]), Plan=SUM(Plan[Amount]), DiffPlan_Act=[Plan]-[Act] … into the CALCULATE together with the bridge-table as the filter-argument:

This is the many2many-technique in it’s simplest form (PostFromMarcoRusso). It all goes via simple aggregation on all accounts found in the filter context:
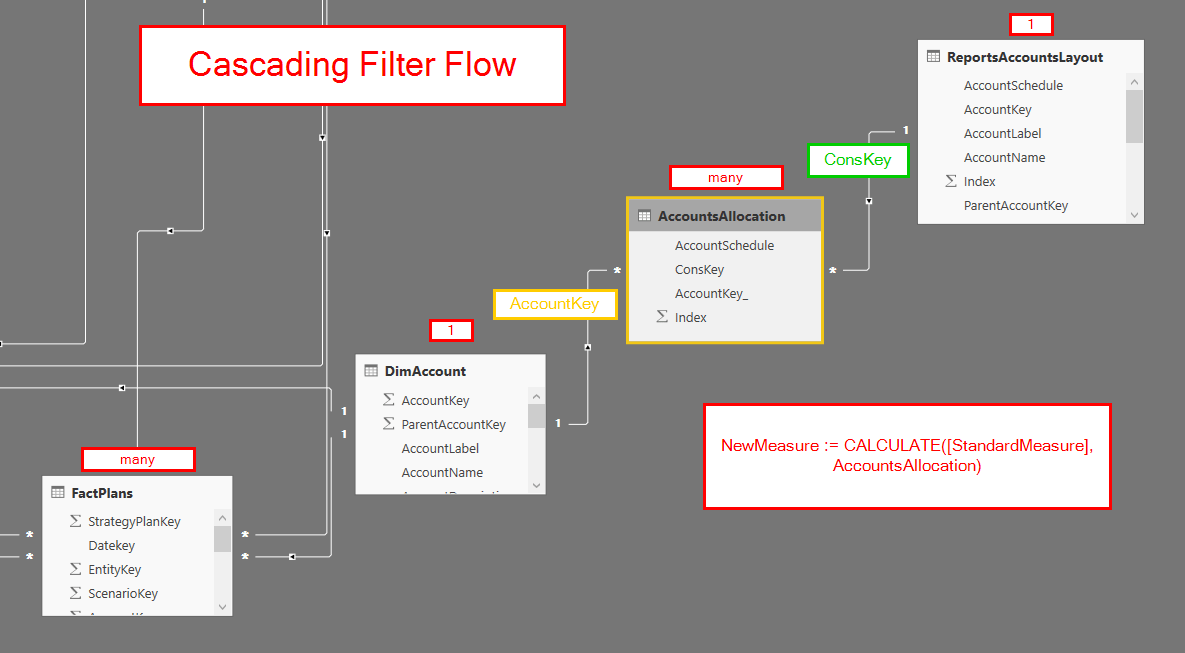
Image4

Our  bridge-table “AccountsAllocation” consists of one account number per simple account and has multiple rows for the (sub-)totals – being all accounts that belong to them:
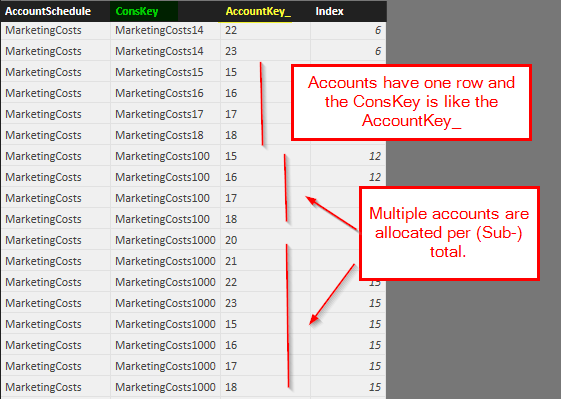
Image5

The ConsKey stands for the row in our report (1) and the AccountKey_ holds the account numbers that are going to be aggregated (many (for the sub-totals) and 1 for the account-rows). So all we need is this unique and simple aggregation on AccountKey for every row in the report – with a filter from the Reports-table via our bridge table to the DimAccounts, who then filters our FactTables: 1 -> many -> 1 -> many.

Read more

Advanced type detection in Power BI and Power Query: Table.ClassifyMixedColumnTypes

This is not a proper blogpost, just a quick share of a function I’ve created today which I think will be very useful for others as well: Automatic type detection will assign only one type to a column, but sometimes there are multiple types in it and then the type “any” will be applied, which means no … Read more