This DAX-VizArt-Wizard vizualizes dependencies between your DAX measures, shows the definition of all related measures and shows differences between the measures of 2 models/versions. This works for Power Pivot, Power BI and for Analysis Services Tabular (SSAS).
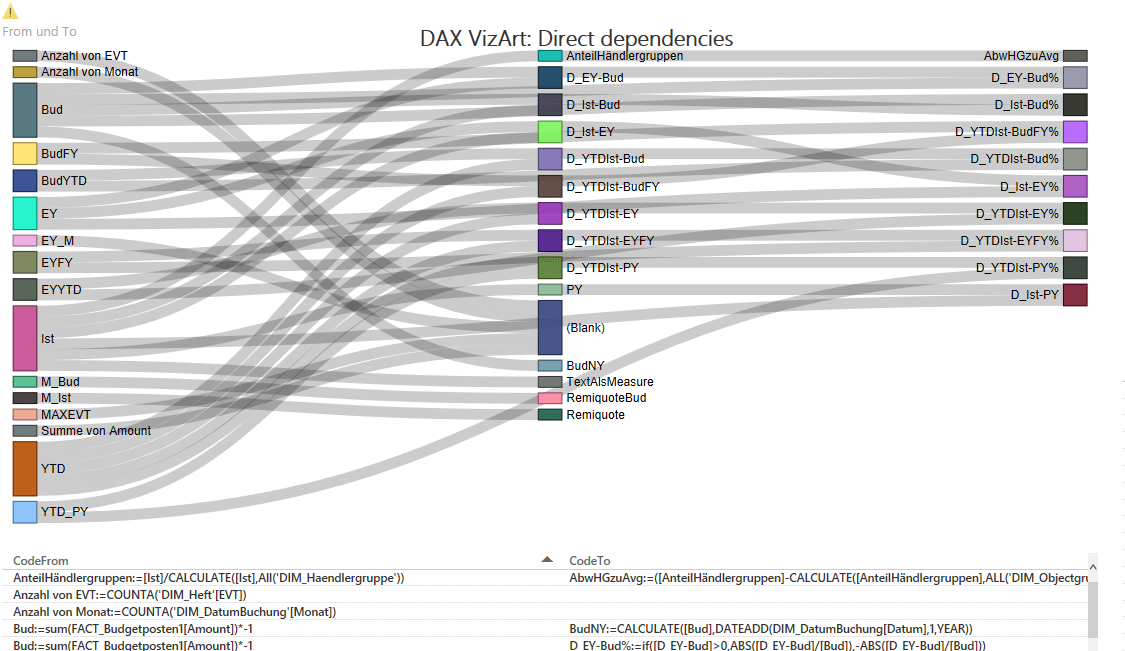
In the Power BI-Version you’ll see them in the Sankey-chart like this:
If select measures/nodes, all direct connections will be highlighted:
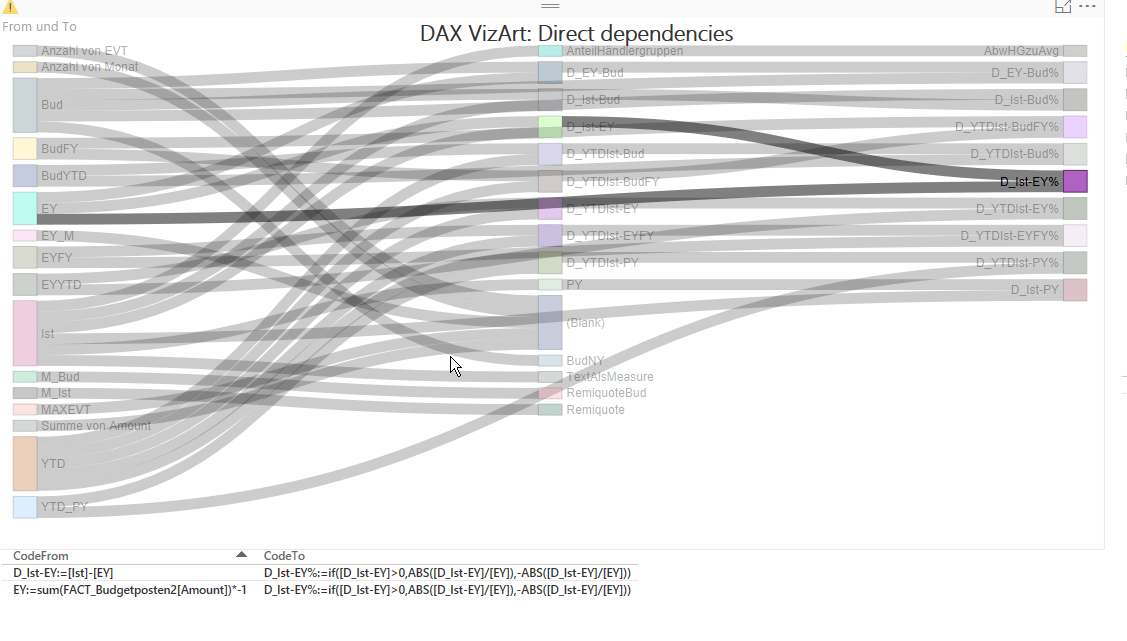
In the second version, all indirect connections will be highlighted as well & the selected measure definitions will be shown.