Date.Networkdays function for Power Query and Power BI

Today I’m going to share my custom NETWORKDAYS function for Power Query with you that uses the same syntax than its Excel-equivalent.

NETWORKDAYS function

This function’s first 3 parameters work just like the Excel function and there is a 4th parameter that allows adjusting the day on which the week shall start:

  1. Start as date
  2. End as date
  3. optional holidays as list of dates
  4. optional number to change the start of the week from Monday (default: 1) to any other day (2 would mean that the week starts on Tuesday instead)

The function comes with a UI that lets you first choose a table containing the holidays and then choose the column with the holiday dates.
Read more

Tidy up Power BI models with the Power BI Cleaner tool

Edit: I am retiring support for this tool for now, as you can find an alternative here: Measure Killer | Brunner BI.
Please feel free to use this tool as it is, but I am not fixing any bugs or provide further help for it. Power BI Cleaner is now published with ‘Power BI Sidetools’ by Didier Terrien: https://github.com/didierterrien/Power-BI-Sidetools/releases Didier may provide help in some cases. Please post issues here:  https://github.com/didierterrien/Power-BI-Sidetools/issues

Edit 27th June 2021: There is a complete new version of this tool that has all the bugfixes and enhancements here: Power BI Cleaner – The BIccountant

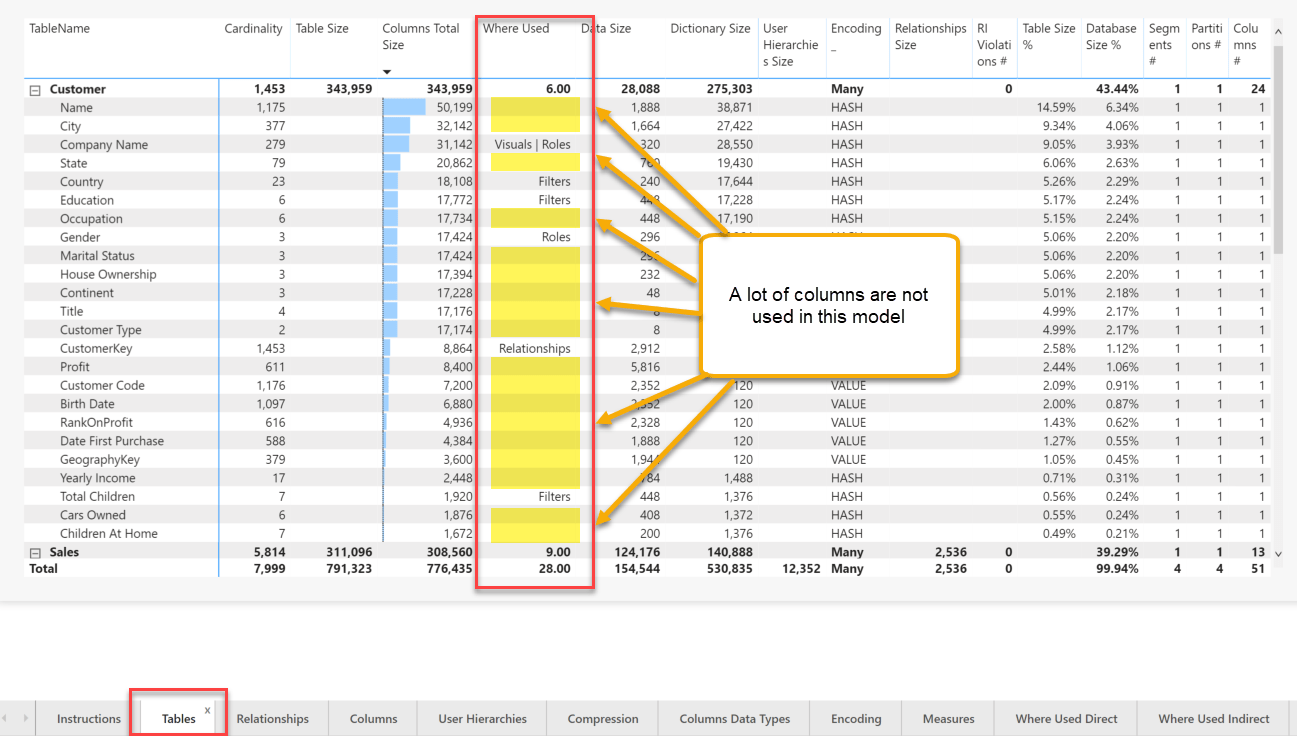
The VertiPaq-Analyzer tool is one of the great community tools that I really cannot live without. It gives me a great overview of all elements in my model and identifies potential performance problems by showing the storage requirements of each column. So when seeing expensive columns, the first question that arises is: “Do I really need this column or could I delete it?”. Luckily, this can now be answered with my new Power BI Cleaner tool. This tool shows the usage of all columns (and measures) within the tables of the VertiPaq Analyzer.

Power BI Cleaner shows unused columns in the VertiPaq-tables

Power BI Cleaner tool

So whenever there is no entry in the column “Where Used” you can go ahead and eliminate the column (or measure) from the model. Well – with two exception actually: Fields used in the definition of incremental load policies are currently not identified as well as used fields in calculation groups. So make sure to consider this before running wild 😉

Read more

Advanced transformations on multiple columns at once in Power BI and Power Query

You can apply simple transformations to multiple columns at once in Power Query using the UI only. In this article I show how you can apply advanced transformations on multiple columns at once instead. You can also use this to use custom functions instead. And lastly for the lazyefficient fans of custom M-functions: You will get a new “TranformAllMyColumnsAtOnceHowILikeIt”-function as well 😉

Background

The Transform-tab in the query editor is sensitive to the columns you select. So if you select multiple number columns for example, some number transformations will be greyed out and are therefore not accessible:

Some symbols are greyed out, Advanced transformations on multiple columns at once in Power BI and Power Query, Power BI, Power Query, Power BI Desktop
Some symbols are greyed out

So how could I then multiply all my columns by 10 for example, as the symbol for multiplication is greyed out?

Read more

Dynamically create types from text with Type.FromText in Power Query and Power BI

In this article I’ll show you how to create types from text in Power Query, enabling you to dynamically change types via functions for example. It’ll come out as a custom Type.FromText function which has been asked for in the comments of this article: https://www.thebiccountant.com/2017/01/09/dynamic-bulk-type-transformation-in-power-query-power-bi-and-m.

Problem

To transform a column to type text can be done like so:

Table.TransformColumnTypes(Source,{{"Column1", type text}})

This transforms the “Column1” from table “Source” to type text.  Now, if you want to make the type dynamic and move it to a function parameter like so:

(VariableType as type) =>

Table.TransformColumnTypes(Source,{{"Column1", VariableType}})

This returns a function dialogue as follows:

Read more

DAX evaluation context indicator with syntax highlighting

This is a post about a feature request, that definitely would make my life easier (and I guess others’ too):

Evaluation context and its transition is one of the hardest concepts in DAX and I would find it extremely helpful, if syntax highlighting would assist us here. Let the colour of the table name show whether the expression will be evaluated:

Read more

Tips and Tricks for R scripts in the query editor in Power BI

Especially if you are new to R, there are some things one needs to know to successfully run R-scripts in the query editor of Power BI. I will share them here along with some tricks that made my R-life in Power BI easier:

How to get started – useful links:

Input:

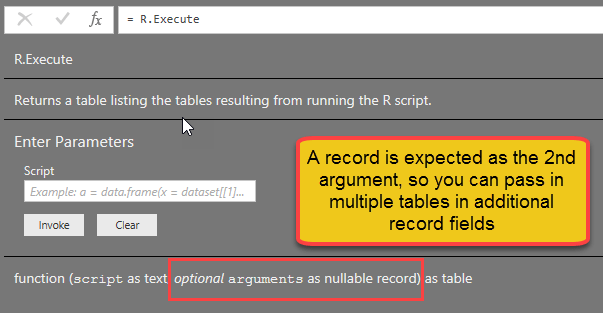
You can feed multiple tables into the R-script

If you click the icon “R script”, the table from the previous step will automatically be passed as the “dataset” to the R-script. So if you don’t fill in any R-code, this will happen:

image

But if you need the content from other tables as well, you just add them into the square brackets like this:

image

“Documentation” looks like this:

image

You can use parameters in the R-script

Apart from tables, you can also use text strings as parameters in the script. They need to be inserted into the code with preceeding “& and trailing &”:

RExportCsv= R.Execute(“write.csv(dataset,” “&CsvExportPath&” “)”,[dataset=Actuals])

Beware that they must be text. So if you want to pass a number, wrap it into Text.From(…).

You cannot use anything else apart from tables and parameters in the R-script

Well, at least I haven’t managed it Smile

R-life gets easy-peasy if you use M-functions for your R-script

Read more