How to create and use an R-function-library in Power BI

Edit 10-10-2017: There is also a (simpler) way to run a custom function library described here: http://www.thebiccountant.com/2017/10/06/create-a-function-library-in-power-bi-using-m-extensions/ . If you go that route, the only point of interest in the article might be how to create your function library automatically.

Once you’ve discovered the huge potential R gives you to expand your analytical toolbox in Power BI (check some tips & tricks in my previous blogpost if you haven’t already), you might wish to have all your awesome functions conveniently at hand when designing new solutions. And thanks to M, there’s actually nothing easier than that: R-function-library in a record (which works just the same for M-functions 🙂 )

Put your functions into a record (fnr) with the function name as the field name and the function itself as the value: One query to hold them all (and not cluttering your editor pane) and ready to use as if they were native functions:
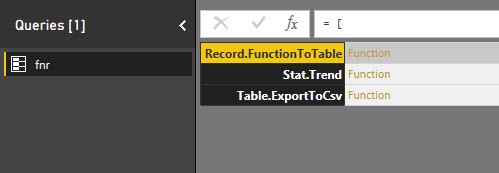
R-function-library

Use

will export content of my query “Actuals” to csv-file on my desktop.

  1. fnr is the name of the record. You can give it your own name of course, I prefer to keep this as short as possible.
  2. followed in square bracket is the name of the function (record field name)
  3. in ordinary brackets you have the function arguments just like in standard M (record value)
Create record

Read more

How to import from Excel with cell coordinates in Power Query and Power BI

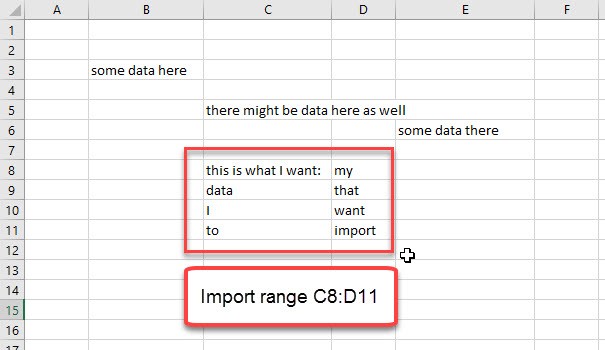
There might be occasions where you want to import data from Excel into Power Query or Power BI using cell coordinates like a range from E3 until G9 for example (“A1 cell reference style”). The function I provide below also caters for the potential pitfalls of this task that Maxim Zelensky has described in his article.

Background

If your worksheet has one leading empty row and column, the import will ignore them and automatically return the range starting from B2. So to fetch the range E3:G9 you have to delete the first row and the first 3 columns. But as Maxim has found out, remaining formats on empty cells will lead to an import of empty rows and columns. So the number of rows and columns to delete will vary and is hard/impossible to predict.

Method

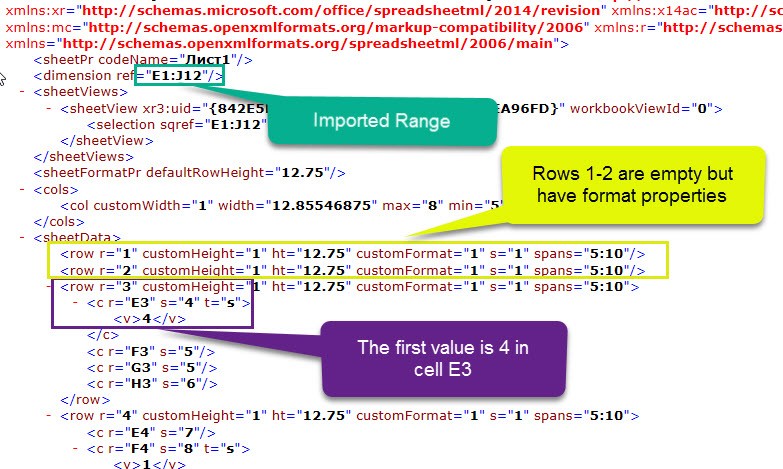
The range that PowerQuery or PowerBI will import is stored in the Excel-file already in the sheet-data and the xml looks like this (“Sample3” from Maxims data):

The imported range is E1 till J12, as the first rows contain formatting instructions, and will therefore be imported as well. In the 3rd row E3 shows up with the first value, which is surrounded by “<v>”.

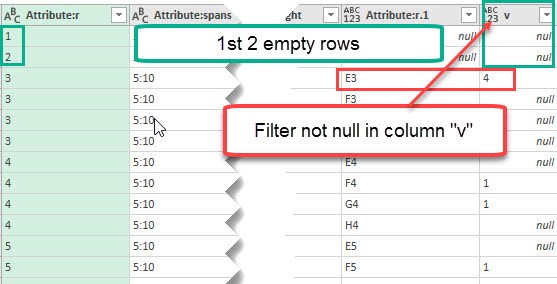
This is how it looks like in the Xml.Table in the query editor:

Task is to calculate the number of rows and columns delete, considering the individual offset that is caused by the formatted empty cells.

Code

So I’ve cooked together these ingredients in a pretty massive code that you can download here: fnImportFromExcelCellCoordinates.txt

How to use the function

Read more

Should we pipe M?

“Just because you could doesn’t mean you should”… So I’m asking the Power Query and M fans & experts here if we “should” pipe M: Background: With M you can nest your expressions like in Excel to group commands that belong together. But this has some disadvantages like: Reading: the execution order of the functions doesn’t match … Read more

How to expand a column that cannot be expanded in Power BI and Power Query in Excel

Especially when working with JSON-data, you might end up with a column that has elements of mixed types in it. The expand column – arrows will be missing, but some elements still need to be expanded, like here: But there is an easy way to fix it: Transform to expandable column Table.TransformColumns(Source, {{“Column1”, each if Value.Is(_, type list) … Read more

Non-linear Break-Even Analysis in PowerBI

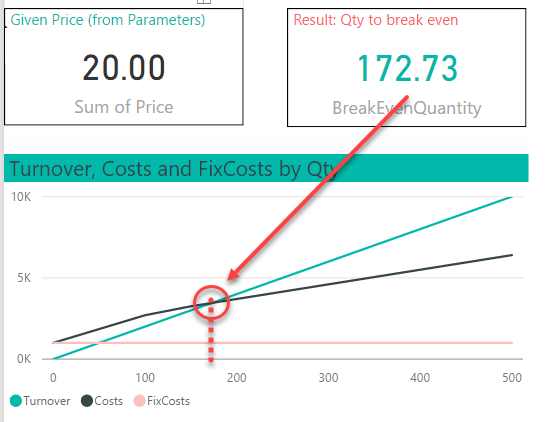
A break-even analysis tells you at which value of the parameter in question your profit-calculation will turn positive (link). Here we need to sell at least 173 at a given price of 20 before we’ve recovered all our costs:

If your variable costs are constant, you can solve it by this formula:

BreakEvenQuantity = Total Fixed Costs / (Unit Sale Price - Unit Variable Costs)

You’ll find tons of examples on how to do this in Excel like here .

Non-linear cost structure

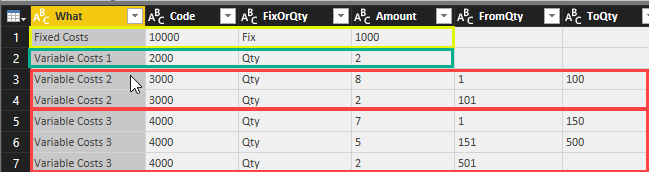
But in real life, the variable costs often depend on certain quantities as you get discounts for purchasing large amounts. The following table shows a cost structure with fix costs in row 1. The 3rd column “FixOrQty” indicates if the cost item is fix or dependent on the quantity (Qty). The 2nd row contains a variable cost that is constant with 2 for all quantities. Row 3&4 show a variable cost of 8 for quantities up to 100 and if you purchase more than 100 the costs will be lowered to 2 for all additional quantities. Row 5-7 have a similar structure, but with 3 quantity ranges:

 Solve with goal-seek algorithm

Read more

KPIs in Easy Profit and Loss for PowerBI

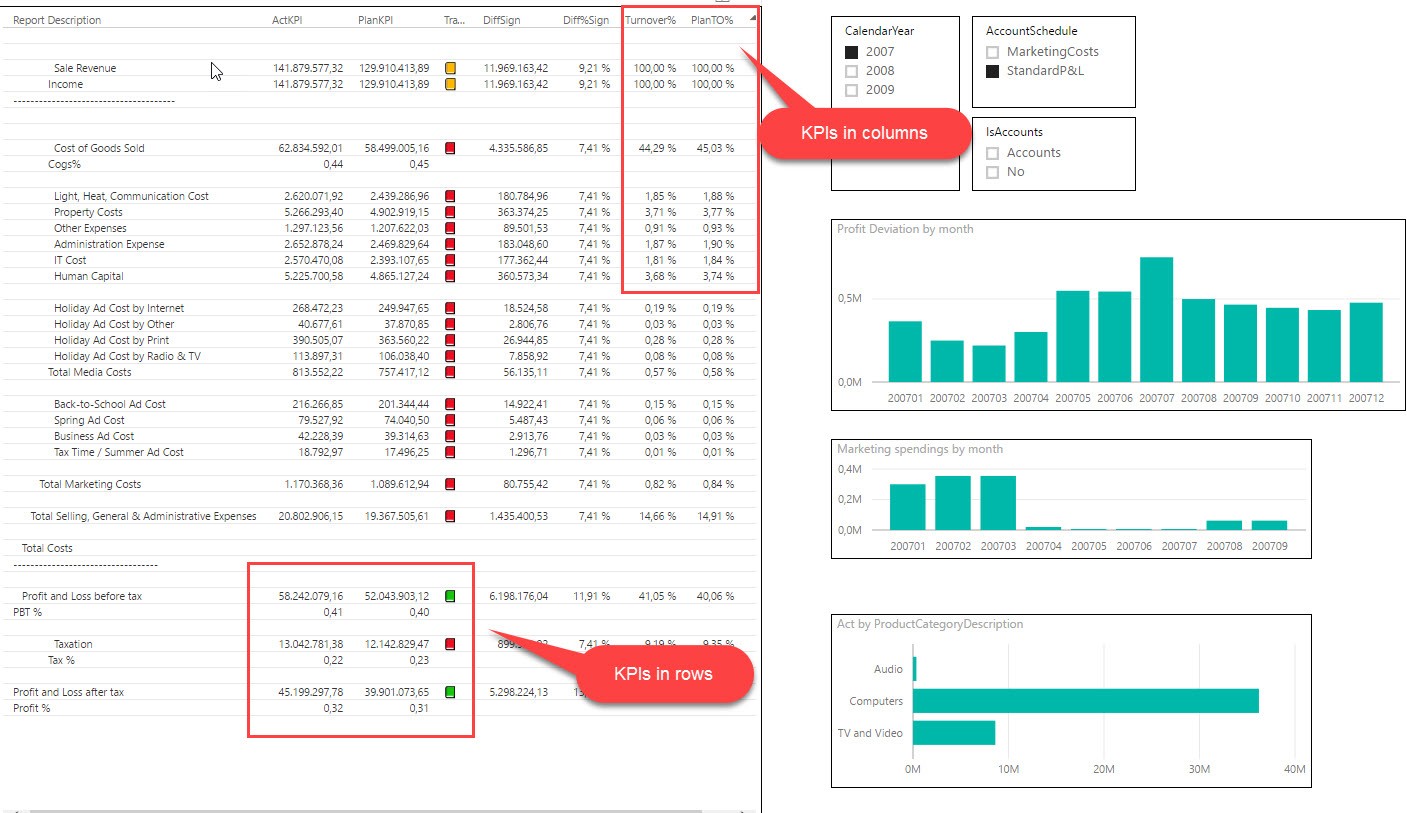
Welcome to the last part of my Easy Profit & Loss series where I will cover KPIs in rows & columns:

1) KPIs in columns

Show all your figures as a percent of turnover for example: Nice & easy: Divide current figure by the total sum of turnover:

Turnover% =
ABS (
    DIVIDE (
[ActSign],
        CALCULATE (
[ActSign],
            FILTER (
                ALL ( IndividualAccountsLayout ),
IndividualAccountsLayout[Description in Report] = “Income”
            )
        )
    )
)
DAX Formatter by SQLBI

We need to leave the current row context to retrieve the turnover-value in each row, therefore the ALL.

2) KPIs in rows

Read more