How to auto-parametrize your Power Query queries

This is about a technique that I’m going to use in my upcoming articles on ICT reconciliation. But as it is useful in other areas as well, it’s getting its own post here:

Say we want to pass the year and month as well as the type of accounts as filters/parameters into our reconciliation query. If our file is stored here:

C:\Users\Imke\Desktop\2015\08\\ICTRec201508_Transactions.xlsx,

we have everything we need. And when the next month comes, we even don’t have to adjust our query, as it will automatically take 09 as the months parameter, providing we store it in the correct folder.

Using: CELL(“filename”) will extract this information into the cell in Excel. Check this cell and pass it to Power Query (as table).
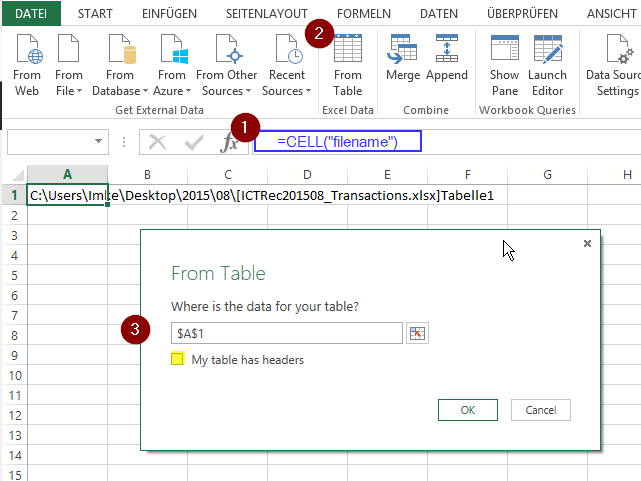
Image1

Now we just have to extract the relevant parts, using an ultracool ninja-trick I just picked up in the TechNet Forum:
Read more

How to compare everything with everything using Power BI or Power Query


A question in Mr. Excel-Forum about how to design your data model if you want to compare values from 10 different (fact-) tables with each other got me curious: As this simply felt so wrong… and where there are 10 tables today, there will be probably be 12 tables next …?

Time for Power Query to play out its strengths on dynamic approaches then: Key is to create one consolidated table from all the different input-tables with an additional column that contains the name of each source table.

If your data sits in Excel tables, you can find the description on how this works in the new Power Query book from Ken Puls and Miguel Escobar, starting on page 47 (key is to keep the name-column!).

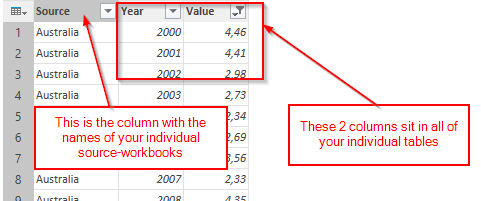
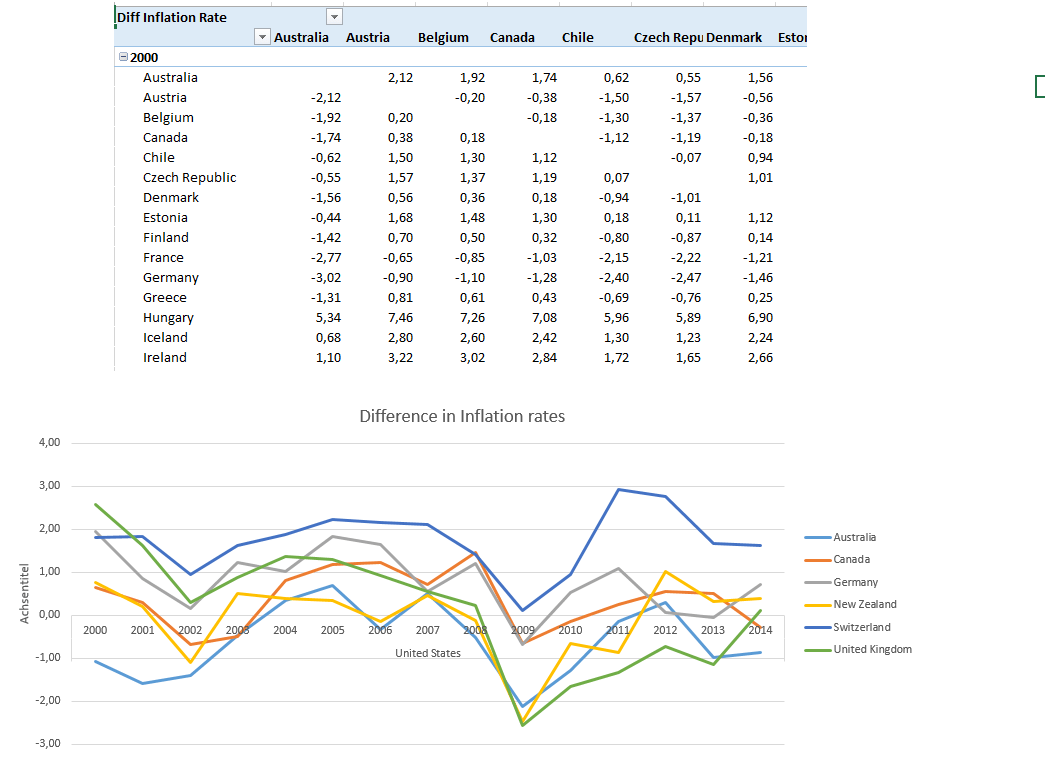
In my example I’m using web-data that already has the format of a consolidated table, comparing inflations rates of different countries with each other. So the data-structure looks like this:

1DataStructure

You then start a new query that refers to your source data and merge it with the source again on the year-column. The year-column shall stay the same, as we don’t want to compare different years against each other, but only different countries (Sources).

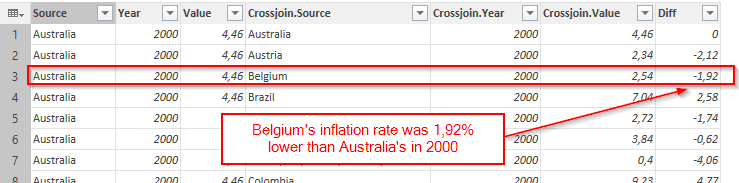
This will actually create a crossjoin of all countries against the country in the respective row – but within the same year. Last step is to create an additional column that calculates the difference between the values. This tells you how the inflation rate of the country to compare against is in relation to the source-country:

2Table

& this is the code:

Read more

Perfect Analysis Services (SSAS) reports in Excel using Power Query

Excel-reports on SSAS cubes (multidimensional and tabular) can have some flaws that now can be overcome by using Power Query for sourcing your cubedata:

  • filter your cube by complete Excel-tables without loading them to the model/cube
  • Apply nice number and date formats to non-measure number and date fields in your row- or column section
  • create fast detailed reports (multiple attributes in your row sections, overcome the slow MDX that the pivots on cubes produce)

As with the recent Power Query update (26) you can now create your own MDX and DAX-statements for retrieving data from a cube, it is also possible to pass individual parameters from your Excel-sheet to the queries. This is a prerequisite for dynamically reducing the number of returned fields to the query, thereby allowing a decent performance of these reports.

So how about filtering the query by a table that sits in your local Excel file? Can we do an inner-join just like on the SQL-server-source

Read more

Filter SQL-server queries with Excel-tables: Query folding limitations and bug workaround

Power Query provides excellent functions to filter your SQL-Server queries by complete Excel-tables instead of just single parameters (like in all other Excel-based approaches). But you need to take care that the filtering is done at the server – before the data is loaded to Excel. This has a huge impact on performance that you don’t want to miss and is called “query folding”. Koen Veerbeck’s article provides a very good overview, links to other usefull resources on this topic as well as a list of limitations for query folding to happen.

Recently I ran into a problem where folding seemed to stopp randomly: Used a table to filter and with some entry sets it folded and some other entries it didn’t. I received very good help from Microsofts Dev-&Support Team on this issue which I thought was worth sharing: They pointed out a bug in the current heuristic that is used to balance load times. This bug means that queries will stop folding now if the number of rows in the Excel-filtertable exceeds 200 rows:

So if the heuristic would work as planned, query folding would take place, if:

Read more

Excel Cubefunctions: Trick for dynamic sets

Today I read Andrew Todd’s brilliant guest post on Powerpivotpro.com about some really cool tricks on cubefunctions. The second one shows a very elegant solution to what I’ve formerly done with my “hidden-Pivot”-technique: Avoid the cubeset-functions by referencing a hidden pivot table instead. So if the set of “cubeslices” you want to use in your reports is static, this is the most elegant way to go in my eyes.

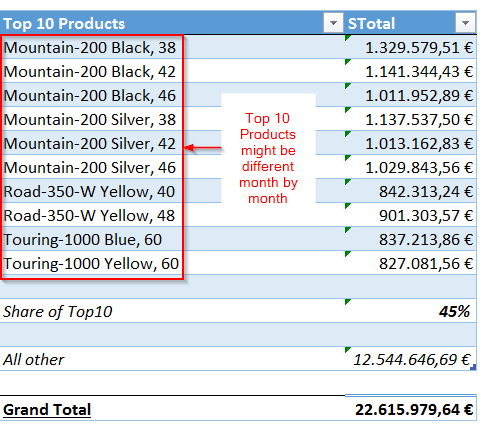
But if it is dynamic, like in a Top-10 ranking or similar, this technique still has it’s reason of being: Say you want to show a section in your dashboards that shows top-x elements, a calculation of their share on the total, then an aggregation on all others and a sum on all like this:

NewImage1

Read more

Power Query Management Studio reloaded: Now supports MDX

Very happy to see that my Power Query Management Studio isn’t just perceived nerdy but useful as well 🙂 Thanks to Dusty for his nice review.

So let’s push it a bit further and add some MDX functions to it that cannot be done by DMVs:

  • get a list of all unique fields used in a specific MDX query
  • translate your code to a different cube using a simple field-translation table

How to use this for MDX:

Read more