In order to pass a list of filter arguments to your pivot table instead of selecting them all manually you can do the following:
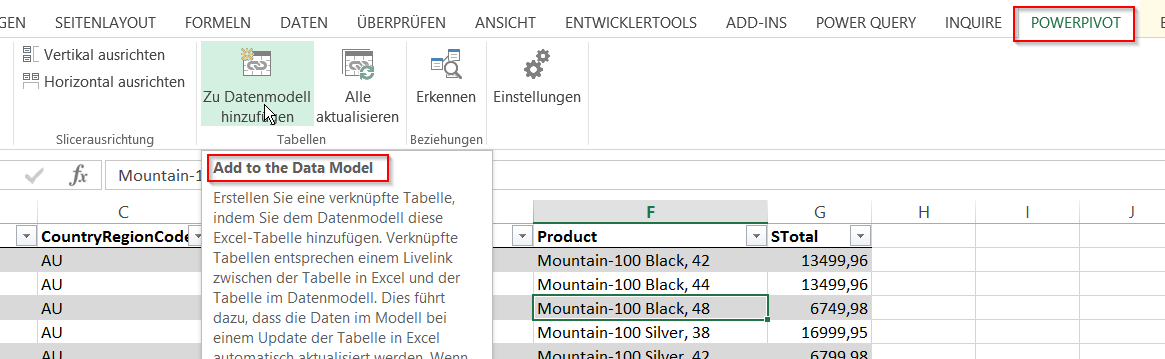
1) Pass your filter table and your data table to the Data Model (Power Pivot):

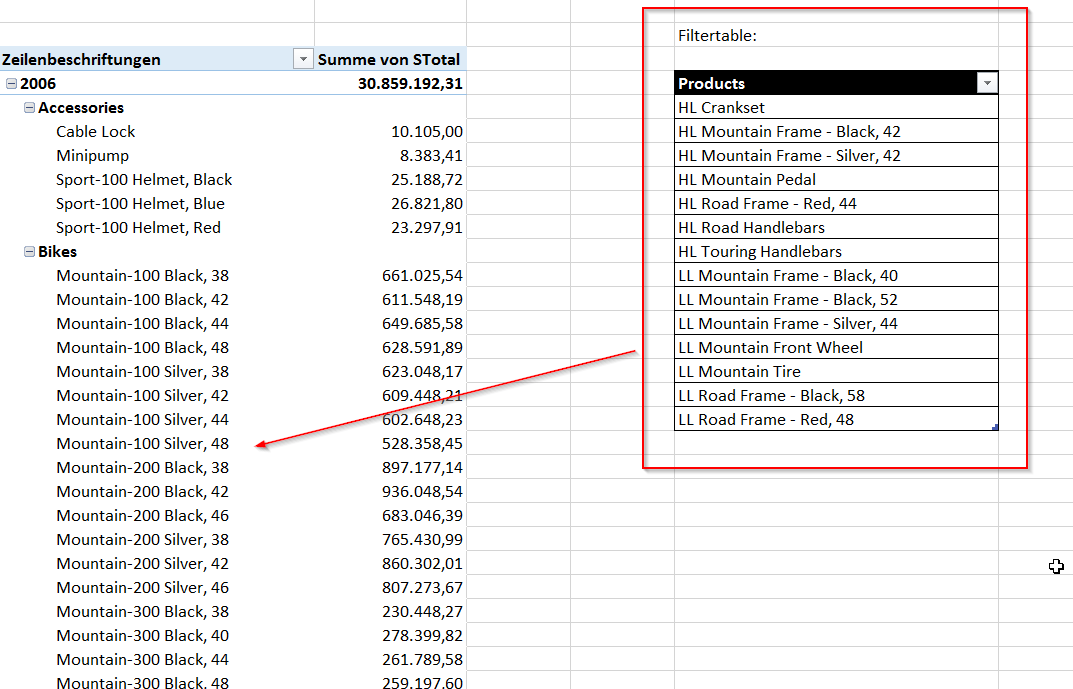
In order to pass a list of filter arguments to your pivot table instead of selecting them all manually you can do the following:
1) Pass your filter table and your data table to the Data Model (Power Pivot):
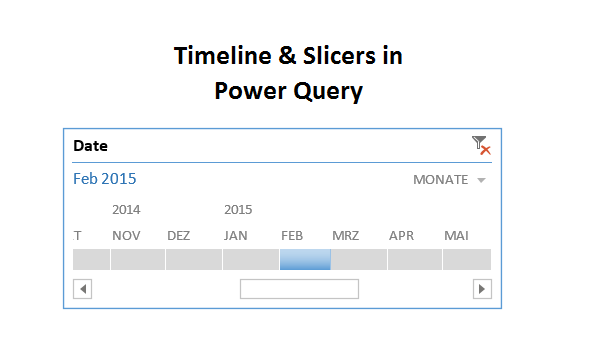
A question in the Mr. Excel forum this morning reminded me that the technique I’ve blogged about here could also be used to do simpler things like using a timeline slicer to filter your Power Query imports. So here’s a quick shot on this: Import your calendar table into the data model (load only) Create … Read more
Creating a Dimension table from a fact table using Power Query is really straightforward using the Remove Duplicates function.
However – you might experience a problem if the key to your Dimension table that you’re extracting from the Fact table is text and not number format. Power Query is case sensitive and will consider “Car” and “car” as different, returning both after the remove duplicates step. Once you load this into your Power Pivot data model, it will be shown there as “Car” and “Car” or “car” and “car”, depending on which term was the first in the list (will always take the first one).
This further means that you will not be able to connect you new Dimension table to your Fact table as the Dimension table now has dups.
To overcome this (and because it might be good practice anyway):

During my evaluation of Power Query as a reporting engine I wondered why we should keep detail fields in our cube at all if the preferred output is a flat table anyway. Cubes are meant for aggregation, aren’t they? Especially in the Finance- & Accounting area you will come across many cubes with detail fields … Read more
When the client is not happy with the pivot report layout options on cubes in Excel, my usual reaction is “OK no problem, then we’re going to use cubefunctions instead”. This went well until recently: My client told me that he wanted a report like above: Years totals first, followed by quarters & months totals, but with growing number of years! All nicely close together, no gaps. Normally I don’t mind cubereports with dynamic table length (will blog about this later), but this is basically 3 dynamic reports under each other (yes they are still alive and will probably stay 😉 ):
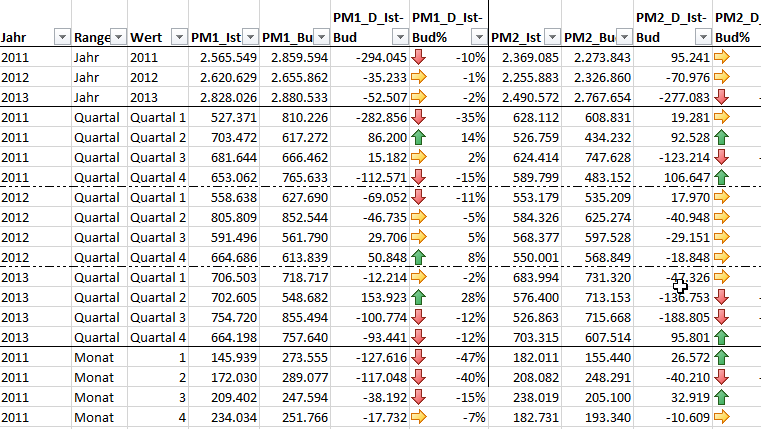
So it was time to test what Chris Webb has talked about in this blogpost: Using Power Query as a report authoring tool in Excel. The idea was to use Power Query’s append-function to attaching 3 different report: Year, Quarter, Month. They could then have different lengths, the append-operation would seamlessly stitch them together. The connection to the cubedata was easy enough, thanks to his brilliant step-by-step guide. But then there were some challenges to solve:
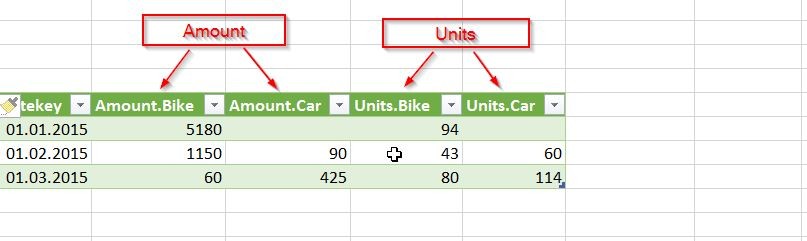
The pivot-function in Power Query lets you pivot your data within the query already. This comes in handy quite often when you want to further work on those results within the query. There’s not much to parametrise in the function, so the question is how to handle it when you want more than one measure/value to be returned.
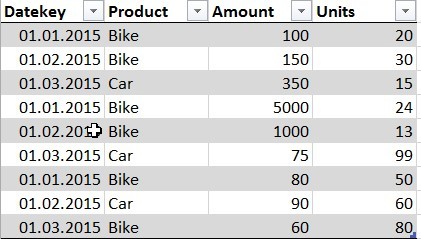
Let’s say you have a table like this:
And it shall look like this:
